Cellular Clarity
Overview
This chart shows the signal strength for the cellular line over time. It also shows changes in cell tower ID, network and radio technology. The chart is only available for lines which have been set up as Cellular Clarity by an admin user.
Sidebar options and colour coding
Sidebar
- Standard MinMax
- Available on week or month only
Standard: Selected by default, shows the average point
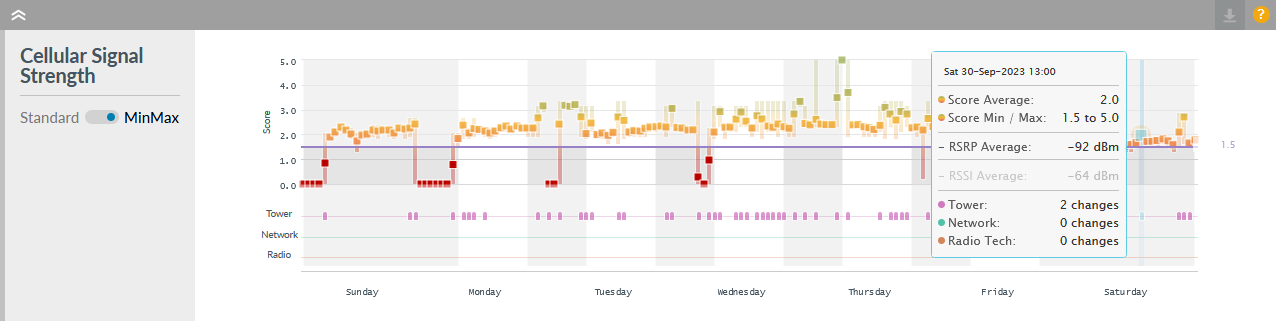
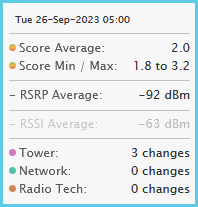
MinMax: Shows an average point and a vertical gradient bar for the minimum and maximum values recorded for the time period
- If you click, hold and drag across the chart to zoom in then this button appears in the top right of the chart - click to revert to the full time period. See GIF in separate section on Zoom options below.
Colour coding
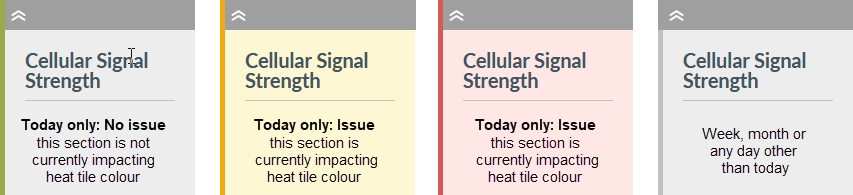
Today only
When viewed for today only, the sidebar for each section on the Details page gives an indication if it is currently impacting the associated heat tile colour. This applies for collapsed sections also.
Saved settings
The settings below will be remembered when you next log in.
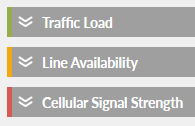
- Whether the panel is collapsed or expanded
- The status of any toggles
Cellular Signal Strength description
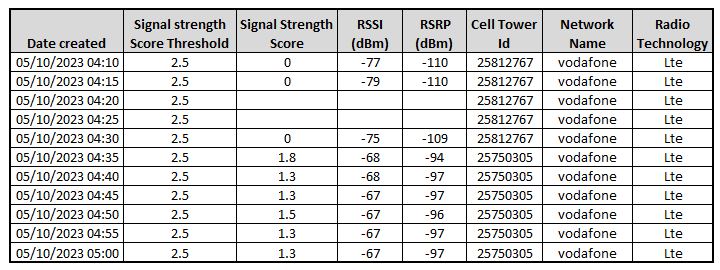
- For day view only, download the information to a CSV file (see sample CSV image below).
- Vertical axis
- Shows scores from 0.0 (Poor) to 5.0 (Excellent). Excellent values are green and near 5 whilst poor values show in red and are closer to 0. Hover on the chart to see exact values.
- 3.5
- The threshold is shown as a horizontal purple line on the chart with the actual threshold value on the far right. If configured, a health alert can be sent when the signal strength drops below the threshold.
- Horizontal axis
- Adjusts according to the selected time period to show hours in day view and days in week and month views; redraws if the time zone is changed at the top right of the Details page.
Note: When signal strength is lost, Highlight shows this as a gap in the chart. Whilst there is no signal strength, there is also no information on cell tower ID, network or radio technology so Highlight registers these values as 0 or null. Changes to null values are not shown as blips - only changes to genuine values are shown.
- Tower
- Shows blips for changes in the cell tower ID
Cradlepoint: Tower changes are not reported in Highlight as the data is not provided by the device - Network
- Shows blips for changes in the network - for example Vodafone to O2
- Radio
- Shows blips for changes in the radio technology - for example LTE to Wcdma
Highlight displays the average recorded value for each signal strength data point in the time period:
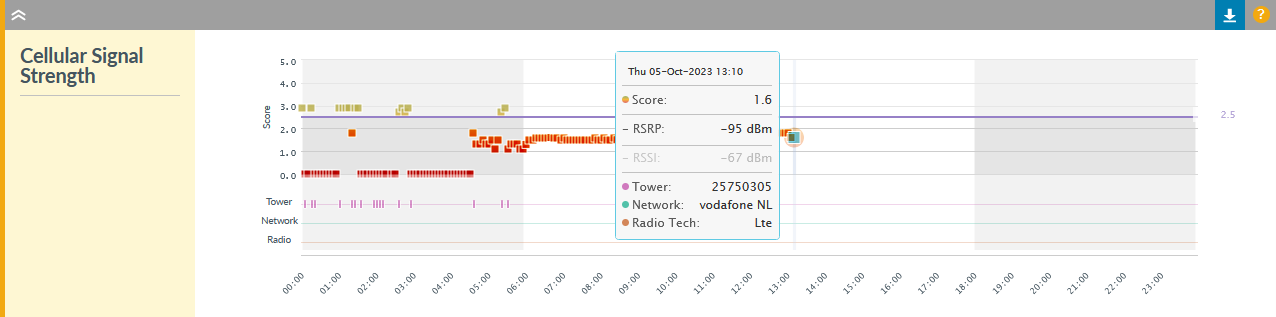
- Day
- Shows multiple data points per hour (one for each polling period, usually five minutes)
- Week
- Shows 24 data points per day (every hour), Average for each hour is shown along with Min/Max values if selected
- Month
- Shows 6 data points per day (every 4 hours), Average for each period is shown along with Min/Max values if selected
RSRP default
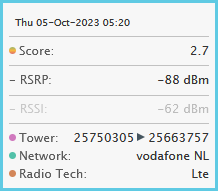
If Highlight receives both RSRP and RSSI metrics, RSRP is used to generate the score. The tooltip shows RSSI in grey for information only. RSSI is used only when RSRP is "Unknown".
From week or month view: clicking any data point jumps to the selected day view. See GIF in separate section on Zoom options below.
Signal Strength Score
Highlight collects two signal strength metrics for a cellular connection: RSRP and RSSI. RSRP is a more accurate, precise metric and usually only available on 4G/5G connections (aka LTE). RSRP is the preferred default metric used to calculate a score between 0 (Poor) and 5 (Excellent). RSSI is only used when RSRP is not available. Using a signal strength score enables Highlight to easily handle a cellular connection which is swapping between 4G/5G (RSRP) and 3G (RSSI).
Scores are equivalent to the values as shown in this table:
| Score | Meaning | RSRP range | RSSI range |
|---|---|---|---|
| 5 | Excellent | -83 and higher | -61 and higher |
| 4.0 to 4.9 | Excellent | -84 to -92 | -62 to -70 |
| 3.0 to 3.9 | Good | -93 to -102 | -71 to -79 |
| 2.0 to 2.9 | Good | -103 to -111 | -80 to -87 |
| 1.0 to 1.9 | Fair | -112 to -121 | -88 to -96 |
| 0.1 to 0.9 | Poor | -122 to -129 | -97 to -104 |
| 0 | Poor | -130 and lower | -105 and lower |
If a threshold has been set then Highlight will send alerts when the score falls below the threshold consistently over a period of time. Refer to the Alerting Threshold dialog.
When no Signal Strength values are available
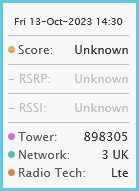
If we do not get a reading on RSRP nor on RSSI, then the score is set to Unknown with the following effects:
- On the chart, there's a gap in the data and no tooltip, unless Tower/Network/Radio are collected then tooltip shows Unknown for Score, RSRP and RSSI.
- On the chart daily CSV, the Score, RSRP and RSSI all show as blank/empty.
- For Alerting, Highlight decrements the Health fuel gauge for the watch for NULL values only if the threshold is set >0. This will eventually change the colour of the side bar - amber then red and send alerts if configured.
- For Reporting, Highlight excludes NULL periods when calculating the average.
- For Reporting API, no change.
Zoom options
There are two methods to zoom in on charts: drag and click. All charts on the details page are synchronised so they zoom in and out together or the whole page jumps to a date on click.
Background colours
Grey/White backgrounds - Business hours
By default, the chart shows non-business hours with a vertical grey background and business hours with a vertical white background on day and week views. Business hours are not shown on a month view. Toggle off to show alternate horizontal grey and white background areas.
Business hours are the time periods (to the nearest hour) that a business is operational. Highlight uses business hours when displaying charts on the Details page, filtering reporting results and generating alerts. Default values are 06:00 to 18:00 Monday through Friday with Saturday and Sunday excluded. However, you may see different settings if the business hours on a parent folder or location have been changed. Business hours reflect the local time zone for the location.
Find out more about business hours.
Purple backgrounds - Maintenance
Any purple background areas on the chart show current and past maintenance periods. Watches in maintenance do not send alerts, change the colour of heat tiles or decrement the availability figure for the time period.
Find out more about maintenance indicators on the details page.