Performance Charts
Overview
Highlight displays the results of performance tests in colourful charts which are visually powerful and easy to interpret. The charts are drawn in slightly different ways depending on which test is used
Description
Highlight performance tests provide visibility of key measurements such as round trip time (RTT), packet loss and jitter between two points on your network. These metrics give a great overview of how healthy a connection is and are often the basis of Service Level Agreements (SLA) between provider and customer.
Performance test results are shown graphically in a chart for instant understanding of how network delay changes in relation to the traffic, health and application fluctuations over time.
Performance testing works over most network types and can be measured across specific Classes of Service (when implemented), proving that prioritised applications within an MPLS network are performing correctly. This ongoing visibility can be the basis for future performance tuning, as new applications and requirements are introduced.

Highlight's integration with Cisco ThousandEyes means you can add an API key to a ThousandEyes controller in Highlight and set it to automatically discover ICMP Ping and HTTP Server tests.
Like other performance tests, Highlight shows a chart for each test on a details page with the parent performance agent. This means you can group ThousandEyes performance tests with other services in a single Highlight location. You can then use all the existing performance test functionality in Highlight with these tests.
Header, Sidebar and Maintenance
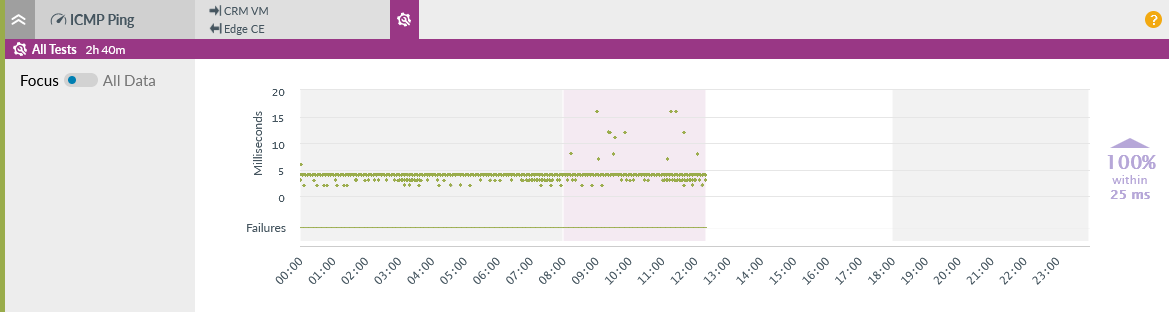
When a performance test is in maintenance, you will see a purple background area on the chart and a marker in the sidebar showing:
- the maintenance icon
- the name of the maintenance window ("All Tests" in the image above)
- the time remaining in the maintenance window (2h 40m in the image above). If it's less than one minute remaining, "<1m" shows.
- if you see a number in brackets (2), this means there's more than one maintenance window in effect for this test. The time remaining is when the first maintenance window is due to end. This time will then adjust to show the next maintenance window in effect.
Note: Performance tests in maintenance do not send alerts nor change the colour of heat tiles
Today only
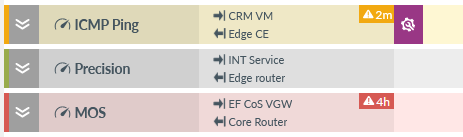
When viewed for today only, the sidebar for each test gives an indication if it is currently impacting the associated heat tile colour. There is an overall colour applied to the Performance Analysis section which applies for the collapsed section also. This overall colour will reflect the test in the worst state.
- Green
- No issue, this test is not currently impacting heat tile colour
- Amber
- Issue with duration (2m in the image), this test is currently impacting heat tile colour
- Red
- Issue with duration (4h in the image), this test is currently impacting heat tile colour
Not today
Controls and axes
- Click to collapse or expand the performance chart, or use Expand All/Collapse All in the top header bar
- Shown to indicate a performance test, created on this watch with the test type
- Target and source descriptions if available otherwise IP addresses or hostnames, hover over the text to view the full text if shortened
- 2m
- If the test has issues, the duration with show in an amber or red box

- If the test is currently in maintenance, this indicator is shown

- If the test is discontinued, this indicator is shown, find out more about discontinued SD-WAN tests
- Vertical axis
- Automatically adjusts to show all the data points for the selected period (day, week or month). Hover on the chart to see exact values.
- The adjusted vertical axis means it may not start from 0. A chevron is shown if this is the case.
-
98%
within
300 ms - The threshold is shown as a horizontal purple line on the chart with the actual threshold value on the far right. The text shows the percentage of tests within threshold.
If configured, a health alert can be sent when the delay goes above the threshold.
If the adjusted vertical axis means the threshold line is not visible then a purple arrow is shown indicating the threshold is above or below the visible chart area. - Horizontal axis
- Adjusts according to the selected time period to show hours in day view and days in week and month views; redraws if the time zone is changed at the top right of the Details page.
- Zoom options
- Drag: click, hold and drag across the chart to zoom into a time period; repeat if needed and if complete
Note: all new chart types are synchronised so they zoom in and out together
Click: on a week or month view, click on the chart to jump to that specific day view
- Focus All Data
- Focus: By default, the chart is scaled to focus on the data. This means show the maximum value data point up to twice the threshold value. Data points above twice the threshold are not shown in Focus mode.
All Data: Toggle to show all data points for the time period. If there are no outliers, then there is no difference between Focus and All Data.
- If you click, hold and drag across the chart to zoom in then this button appears in the top right of the chart - click to revert to the full time period, read more about the Zoom options.
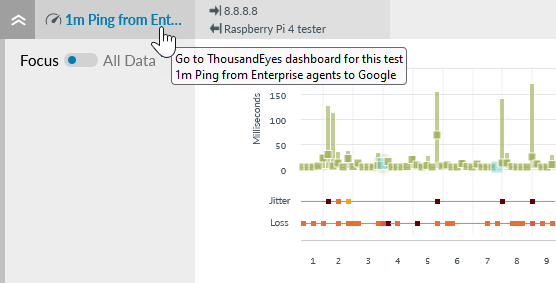
By default, ThousandEyes tests show the test name on the external system rather than the test type (HTTP Server for example).
As shown in the image below, if Dashboard - Display link is checked on the parent controller then the name of each performance test on the performance agent details page is also a link to that test in the ThousandEyes dashboard.
HTTP Server
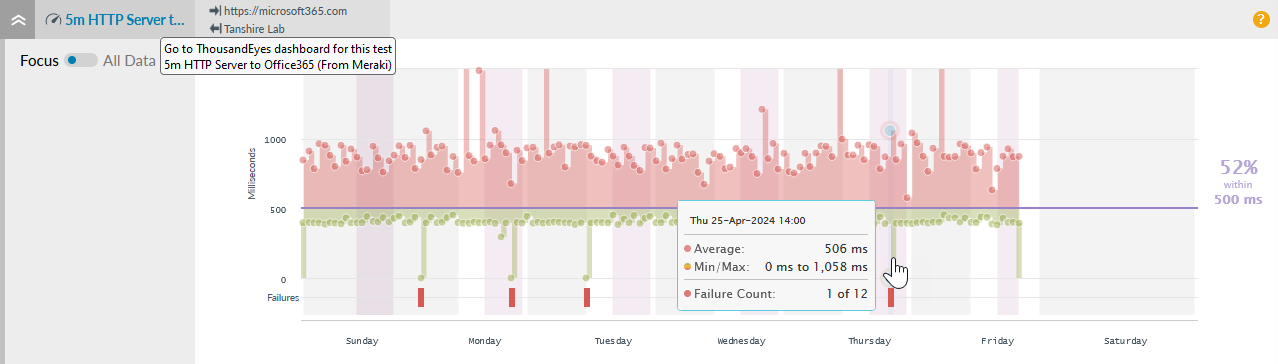
This chart shows the total time between two points known as the source and the target. A data point is plotted for each test on a day, with the average and min/max shown for week and month. The colour shows the test response compared with the threshold: green when measurements are within threshold turning red when measurements exceed the threshold. The failures line shows a red blip representing errors.
Data granularity
Highlight displays the recorded values in the following ways:
- Day
- This depends on the test frequency set on the external system
- Week
- Shows 24 data points per day (every hour), Average for each hour is shown along with Min/Max values
- Month
- Shows 6 data points per day (every 4 hours), Average for each period is shown along with Min/Max values
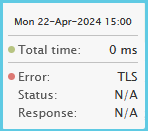
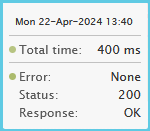
Day view - hover on a point to see timestamp and total time in milliseconds plus any error. If there is no error or an HTTP error, then Status and Response are shown. For any other error type, Status and Response show "N/A". For total time, a green dot indicates tests at or below the threshold, a red dot indicates results are above the threshold. A green dot is shown for Error = None, a red dot shows for anything other than None.
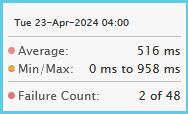
Week or month view - hover on a point to see average, minimum and maximum values for total time plus a count of the failures against the total polls in the period.
From week/month view Clicking any data point jumps to the selected day view.
Failures
Failures are shown as a red blip when an error occurred. It's a grey line if there was no error. Hover on the chart to see timestamp and precise values. On week and month view, errors are counted for the time period (one hour on a week view, 4 hours on a month view).
The full list of possible errors is:
- None - no error
- DNS
- Connect
- TLS (formerly SSL)
- Send
- Receive
- HTTP
- Content
Refer to ThousandEyes documentation for a definition of each error.
ICMP Ping, UDP Echo and TCP Open
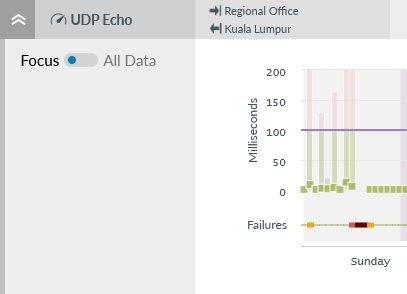
ICMP Ping, UDP Echo and TCP Open tests all use the same type of chart:
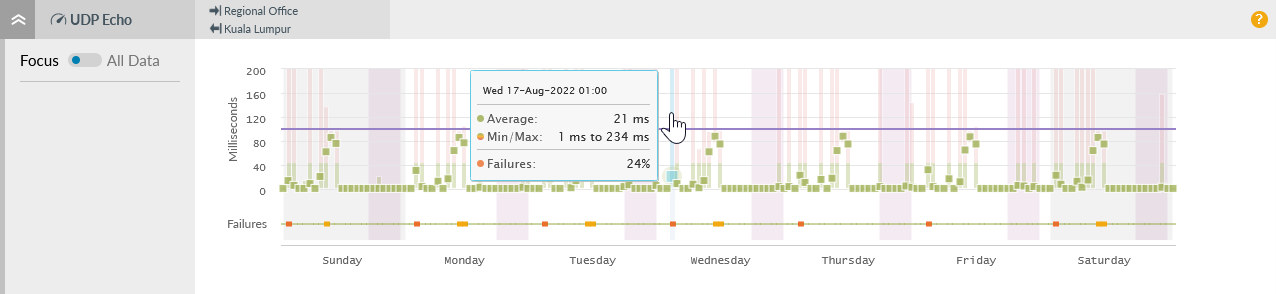
This chart shows the delay between two points known as the source and the target. A spot is plotted for each test on a day, with the average and min/max shown for week and month. The colour shows the test response compared with the threshold: green when measurements are within threshold turning red when measurements exceed the threshold. The failures line shows a coloured blip representing the percentage packet loss.
Data granularity
Highlight displays the recorded values in the following ways:
- Day
- Shows up to 6 data points per polling period (usually three minutes)
- Week
- Shows 24 data points per day (every hour), Average for each hour is shown along with Min/Max values
- Month
- Shows 6 data points per day (every 4 hours), Average for each period is shown along with Min/Max values
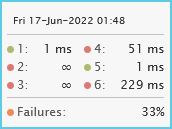
Day view - hover on a point to see timestamp and precise values for up to 6 results per polling period plus the failures percentage. Green dots are tests at or below the threshold, red dots are above the threshold. ∞ indicates a test that timed out/failed
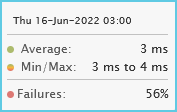
Week or month view - hover on a point to see average, minimum and maximum values plus the failures percentage
From week/month view Clicking any data point jumps to the selected day view.
Failures
Failures are shown as a coloured blip where packet loss occurred. It's a grey line if unavailable or a thicker green line if available and 0%. Hover on the chart to see timestamp and precise values.
Failures represent the worst case - the number of failures divided by the total number of tests as a percentage.
| Colour | Green line | |||||
|---|---|---|---|---|---|---|
| Packet Loss % | 0% | 0.01% to 20% | 20.01% to 40% | 40.01% to 60% | 60.01% to 80% | 80.01% to 100% |
For example if Highlight collects 6 performance test results in a single poll and 2 of the 6 had failed (33%), an orange blip will be displayed.
Precision Delay and MOS
Precision Delay and MOS use the same type of chart (with MOS values available only on the MOS test chart):
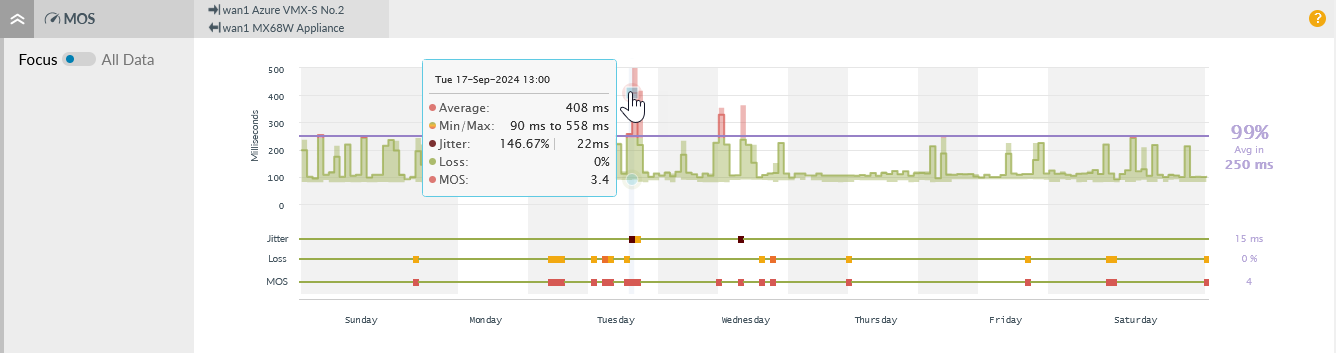
This chart shows the delay between two points known as the source and the target. The average and min/max are shown for day, week and month. The colour shows the average test response compared with the threshold: green when measurements are within threshold turning red when measurements exceed the threshold. There are 2 or 3 additional blip lines for jitter, loss and MOS.
Data granularity
Each test comprises sending 100 128-byte packets at intervals of 50 milliseconds. Green indicates tests at or below the threshold, red indicates tests above the threshold. Highlight displays the recorded values in the following ways:
- Day
- Shows a data point per polling period (usually three minutes), Average for each test is shown along with Min/Max values
- Week
- Shows 24 data points per day (every hour), Average for each hour is shown along with Min/Max values
- Month
- Shows 6 data points per day (every 4 hours), Average for each period is shown along with Min/Max values
Day, week and month view - hover on a point to see timestamp and precise values per polling period plus the jitter, loss and MOS values
Jitter
Jitter is shown as a colour blip based on the calculated jitter value as a percentage of the configured jitter threshold. It's a grey line if unavailable. It's a thicker green line if available and up to 50% of threshold through to red (100% of threshold). It remains dark red if the threshold is exceeded. Hover on the chart to see timestamp and precise values.
| Colour | Green line | ||||
|---|---|---|---|---|---|
| Jitter % | 0% to 50% | 50.01% to 65% | 65.01% to 80% | 80.01% to 100% | Above 100% |
Loss
Loss is shown as a coloured blip where packet loss occurred. It's a grey line if unavailable or a thicker green line if available and 0 - 0.50%. Hover on the chart to see timestamp and precise values.
| Colour | Green line | ||||
|---|---|---|---|---|---|
| Packet Loss % | 0% to 0.50% | 0.5001% to 1% | 1.01% to 2.5% | 2.501% to 5% | Above 5% |
MOS
Note: MOS is available on the MOS test chart only, not on the Precision Delay chart
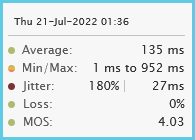
MOS is the Mean Opinion Score and a measure of the perceived quality of an audio connection, scored from 1.0 (poor) to 5.0 (excellent) influenced by delay, loss and jitter. Typical configured threshold values are 3.5 or 4.
MOS is shown as a grey line if unavailable or a thicker green line if available and at or above the configured threshold value. It's a red blip when it's below the configured threshold value. Hover on the chart to see timestamp and precise values.
| Score | Meaning |
|---|---|
| 5 | Perfect |
| 4 | Good |
| 3 | Fair |
| 2 | Poor |
| 1 | Unusable |
Background colours
Grey/White backgrounds - Business hours
By default, the chart shows non-business hours with a vertical grey background and business hours with a vertical white background on day and week views. Business hours are not shown on a month view. Toggle off to show alternate horizontal grey and white background areas.
Business hours are the time periods (to the nearest hour) that a business is operational. Highlight uses business hours when displaying charts on the Details page, filtering reporting results and generating alerts. Default values are 06:00 to 18:00 Monday through Friday with Saturday and Sunday excluded. However, you may see different settings if the business hours on a parent folder or location have been changed. Business hours reflect the local time zone for the location.
Find out more about business hours.
Purple backgrounds - Maintenance
Any purple background areas on the chart show current and past maintenance periods. Watches in maintenance do not send alerts, change the colour of heat tiles or decrement the availability figure for the time period.
Find out more about maintenance indicators on the details page.