Quick Start Guide
Overview
- Quick Start Guide PDF
- Video guide on accessing help
This Quick Start Guide will give you a great start with Highlight, but you can find more detailed information in the rest of the Help and Support Centre. In addition you can get find answers in the following ways:
Contextual help
The quickest way to get help in Highlight is to use our contextual help pop-ups, opened via the amber question mark buttons found throughout Highlight. Contextual help gives you specific information for the Highlight element you are looking at and also, if needed, a link to detailed documentation.
Phone support
If you prefer some personal assistance you can contact your support team who will be able to help you with any issues or questions. Click the user menu side bar then Domain contact details for your service provider's support team details. Alternatively, click About in the same menu for Highlight's support team details.
Screen Layout
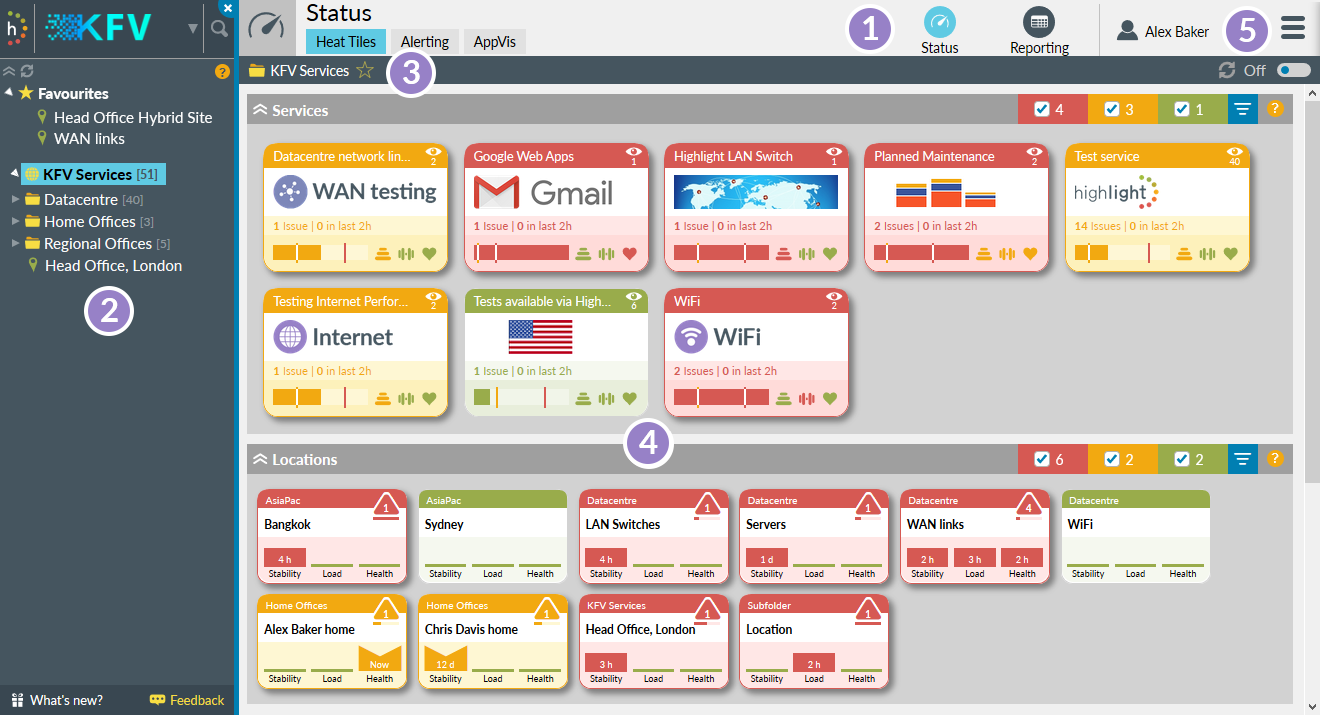
Main navigation
Use the main area buttons and tabs to select your viewNetwork Explorer
Select your location in the networkLocation bar
Displays the current folder/location and path; on the details page the name of the watch is also shownMain content
Shows the selected view - in this case the status of your network locations and servicesUser menu
Change your password or log out; quick links to Highlight pages and Support, plus Domain and version information.
Network Explorer
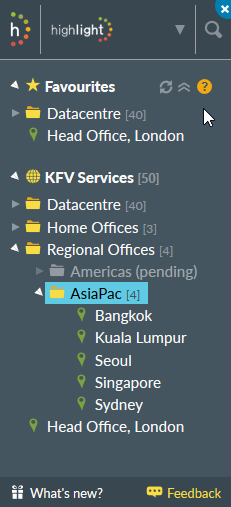
See your entire network as folders and locations
Watch the Network Explorer tree video
Folders
Can contain locations and subfolders
- Use the triangle to expand/collapse a folder. Note: clicking on a folder or location opens the Status Heat Tiles page for that folder or location.
- [n]
- The number of devices if greater than 1 in or below this folder, for details see Reporting Inventory.
- Grey indicates a folder with no activated devices. Note: there may be devices in Pending awaiting activation.
Locations
Contain individual monitoring tasks (watches)
- Grey indicates a location with no activated devices. Note: there may be devices in Pending awaiting activation.
Functions
The following options are available:
- Collapse
- Collapse the tree
- Expand
- Expand the tree (only visible if the tree is collapsed)
- Search
- Find locations or folders, and devices by name or IP address
Watch the Search video - Reload
- Refresh the tree (only appears on hover) which updates it for folders or locations that have been added, changed or removed
- Collapse
- Close all open folders (only appears on hover)
- What's new
- Click to see new features in place of the usual tree of folders and locations. A red background dot indicates new information is available. Once viewed, the red dot disappears until the next update.
- Feedback
- Opens an on screen simple message for passing information to the system provider

Favourites Use the star icon in the title bar to add folders or locations to your favourites. This pins them to the top of the Network Explorer tree. Find out more about Favourites.
Watch the Favourites video
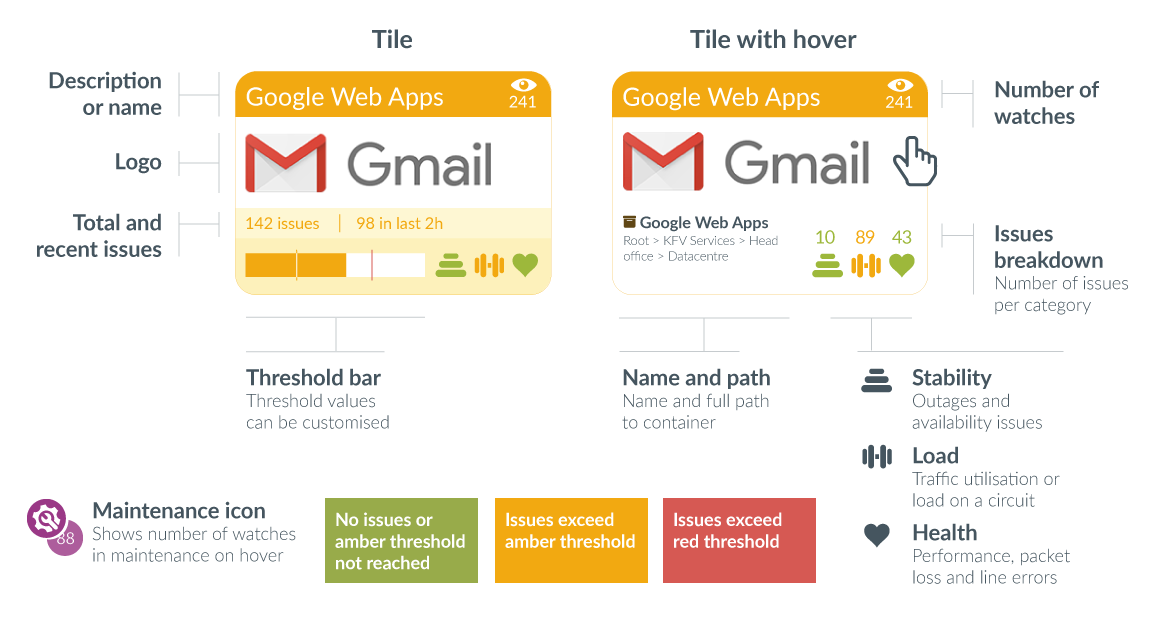
Heat Tiles
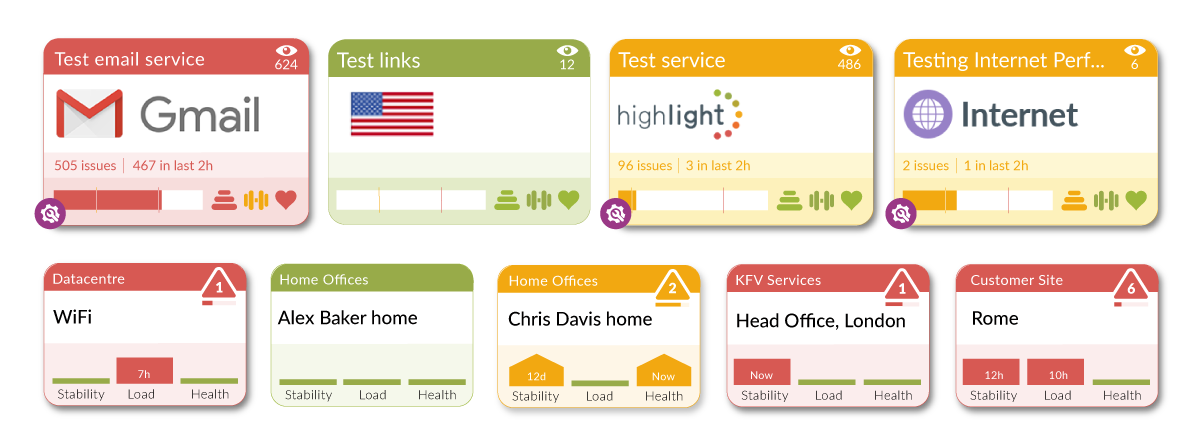
Heat tiles show an instant overview of your network and services.
Heat tiles are more than a simple traffic light system. They have built in intelligence and work like a fuel gauge. Degraded service drives the colour change through amber to red. They represent the current status of each location or service and are a combination of many monitored elements summarised as three key metrics: Load, Stability and Health
Watch our videos: heat tiles and service tiles
Service tiles
Allow watches from any location in your network to be grouped into a single tile, custom-define thresholds to change tile colour based on the total number of issues
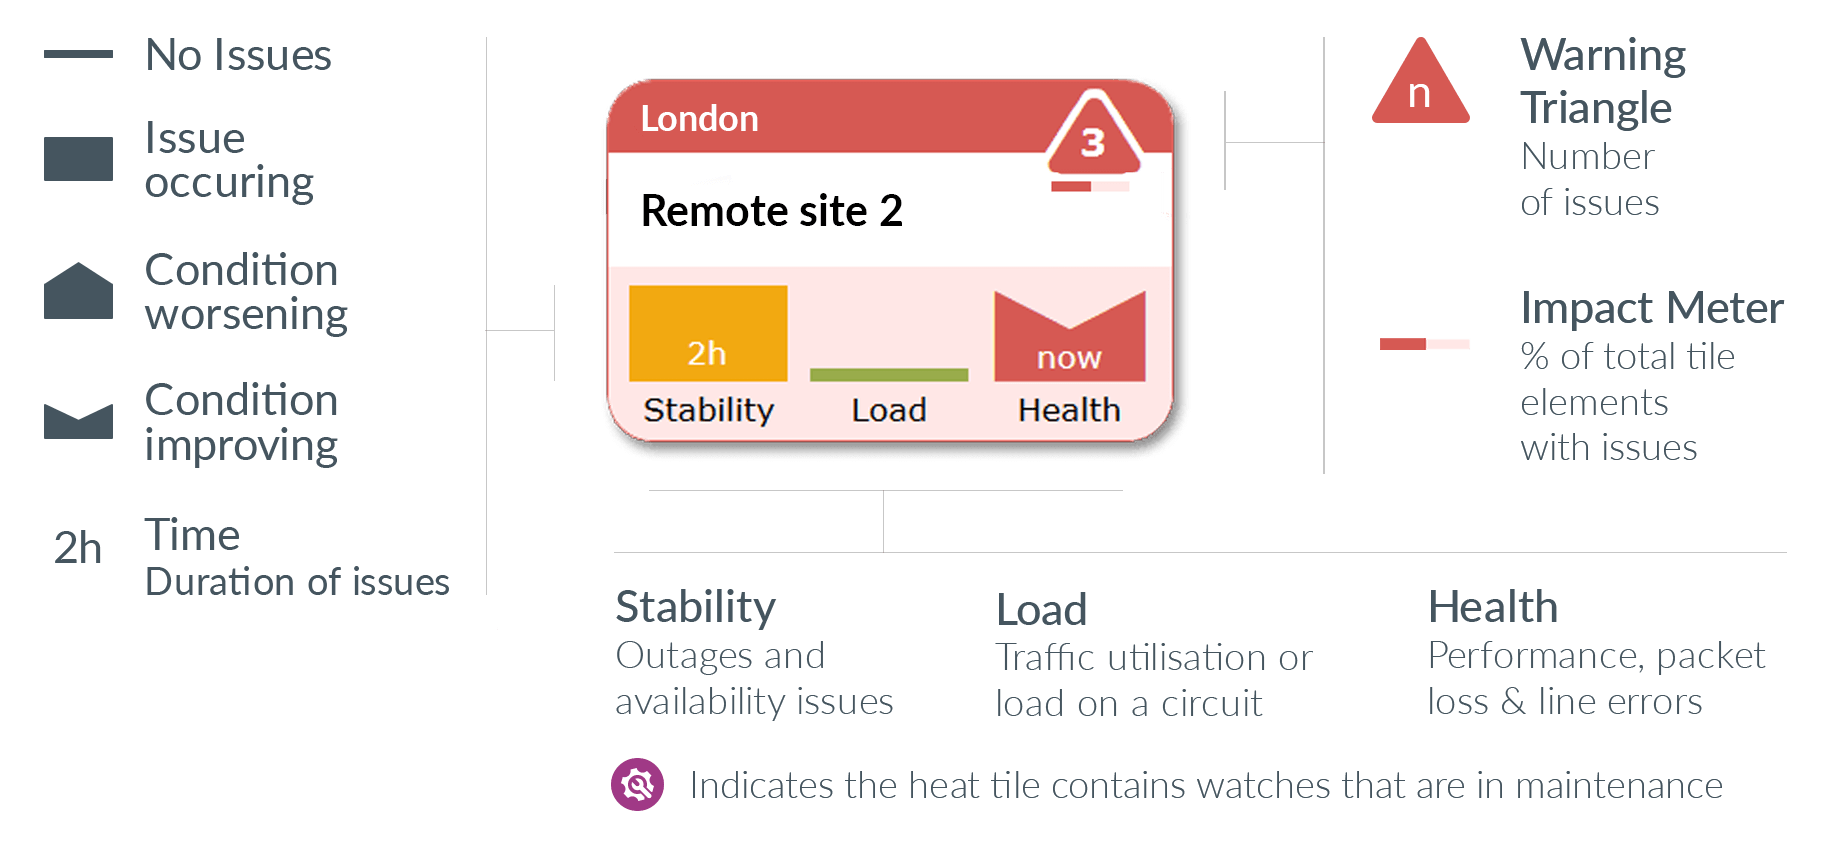
Location tiles
Every location within your network is shown as an individual tile. Indicators show the duration and state of an issue. Up chevrons show a continuing issue and down chevrons show an issue returning to a healthy state.
Read more about heat tiles or watch the heat tiles introductory video
Grid view
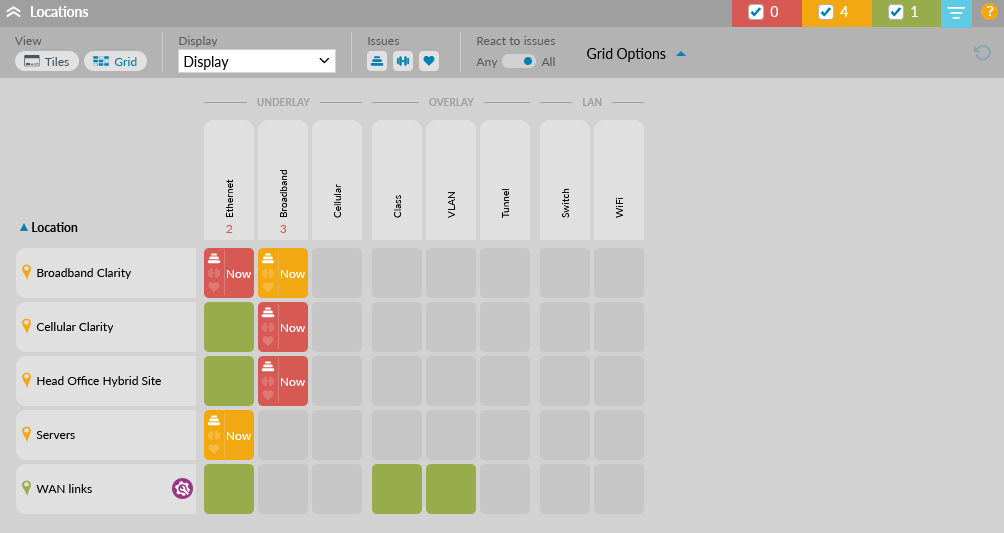
Highlight's Grid View offers an alternative way to view your locations and folders by categorising services into Underlay, Overlay and LAN columns:
- scan across rows to see the status of different services at a location
- scan down columns to see, at a glance, if issues are occurring with particular services
- sort by service to find the most recent issues
- use Group by folder to see multiple locations represented as a single folder - useful for service providers to quickly check on the status of many customers
Find out more about grid view.
Alerting
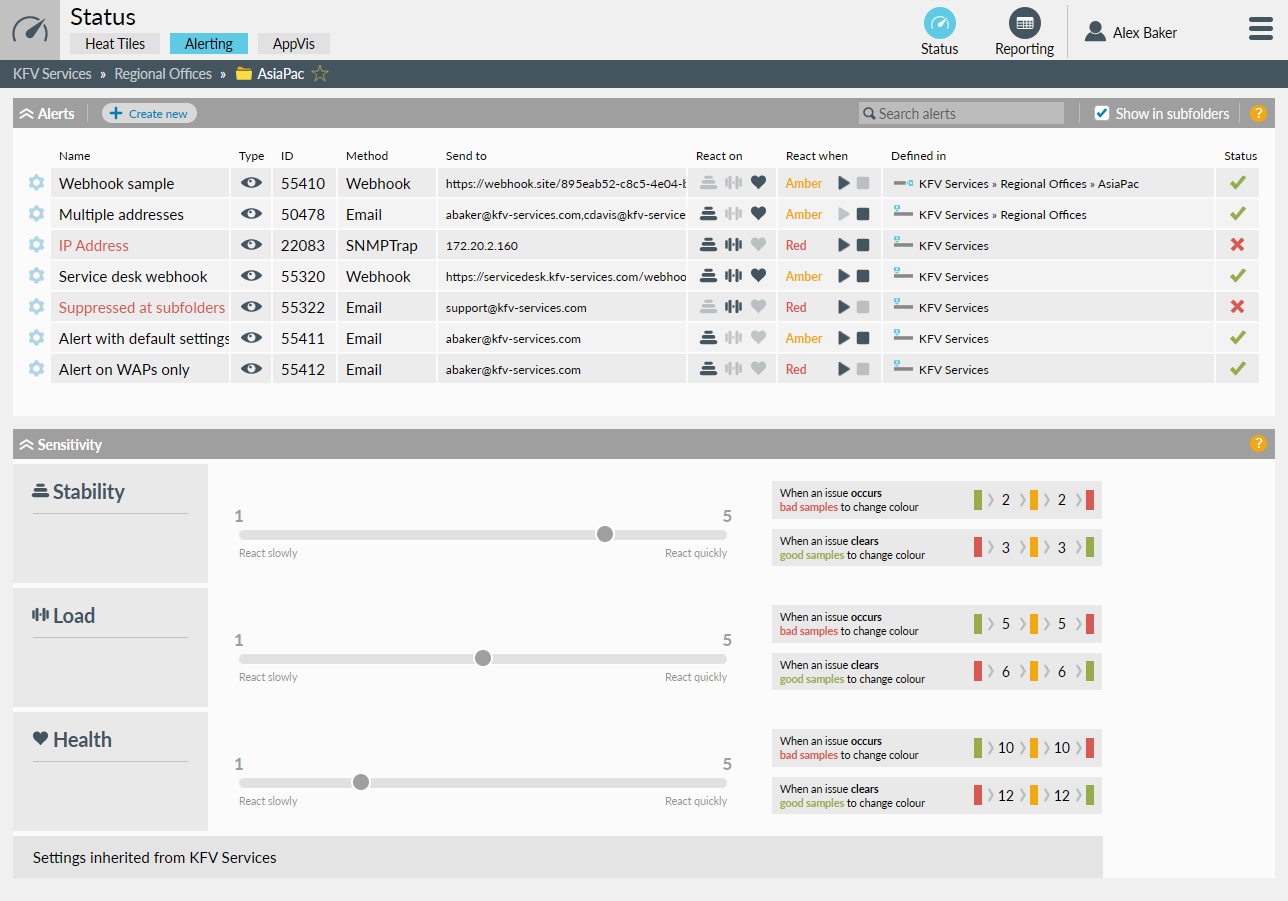
Alerts trigger immediate emails, webhooks or traps if there are problems with your network or services.
Located in the Status area, alerting will allow you to create alerts and define when, how, and to whom notifications are sent. Specify whether you want notifications outside business hours, who should be informed (mailing lists or multiple email addresses can be configured) and which folders/locations are to be included.
There is no limit to the number of alerts so create as many as you require
Read more about alerting or watch the alerting video
Alerting sensitivity
Also visible on the Alerting page is the sensitivity panel. This shows how quickly Highlight will change the colour of heat tiles and send alerts for stability, load and health issues.
Read more about sensitivity
Reporting
The latest trend: Highlight Reporting Insights
Use Reporting Insights to:
- View reporting data graphically
- Compare to previous months
- Display the table for additional details
Read more about Reporting Insights
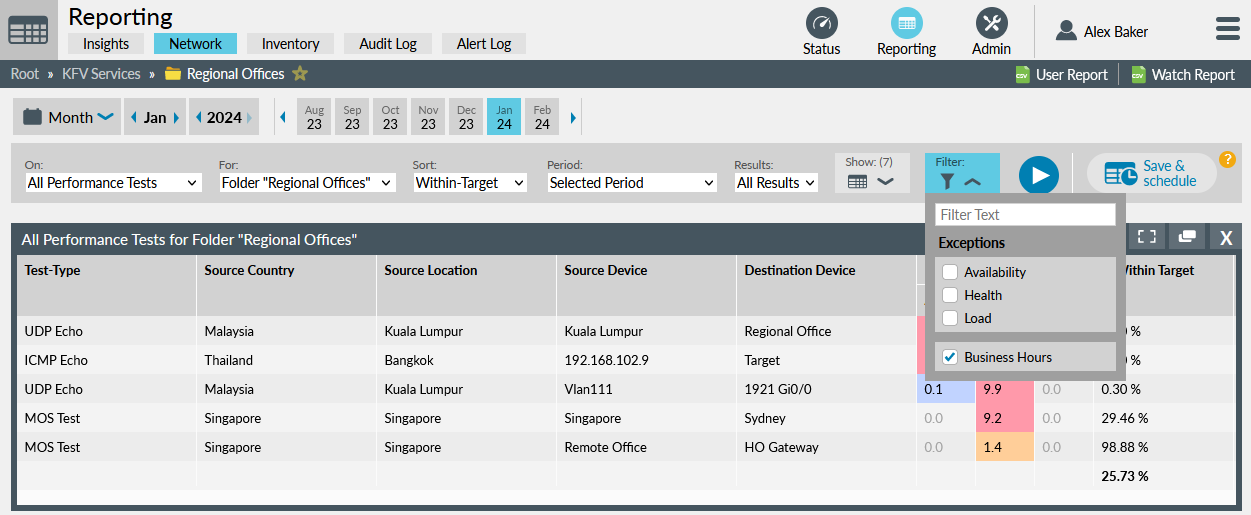
Highlight's powerful reporting engine generates fully customisable reports quickly
You may want a report that shows all issues and outages for the previous month, in your inbox on the first of the month; or a weekly list of circuits that are overloaded sorted by the most congested. Create your own reporting template to define only the data that interests you, in the format you want.
On demand
Pick the folder or location you are interested in and choose settings and filters for the report. Click for an immediate report
Save templates and schedule via email
Select Save & Schedule to remember your choices as a new template or to set up scheduled reports via email
Read more about reporting or watch the reporting video.