Release notes - April 2020
20.4 launches Meraki SD-WAN support in Highlight
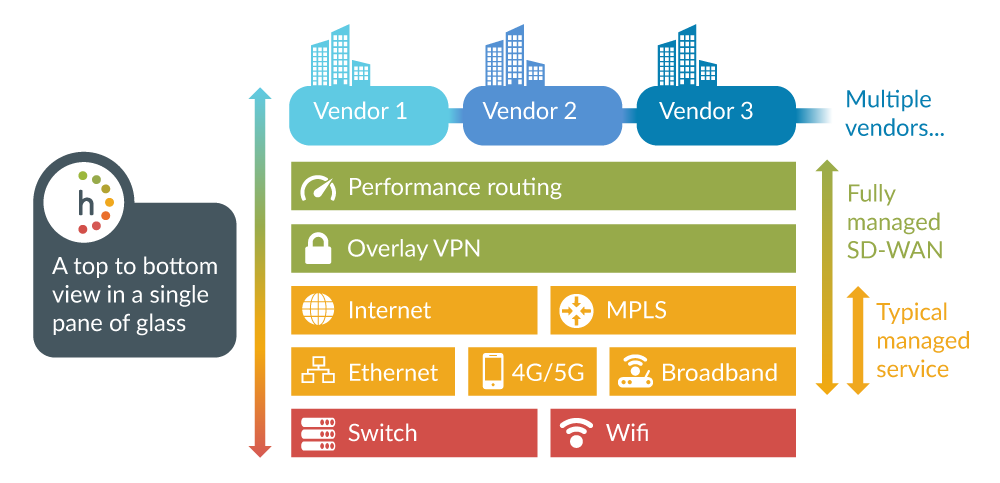
Highlight enables a seamless transition from an existing MPLS network to SD-WAN using one tool.
Highlight’s SD-WAN is designed to be vendor agnostic allowing a range of SD-WAN manufacturers to all be displayed on a single dashboard. Cisco Meraki is the first vendor we are working with.
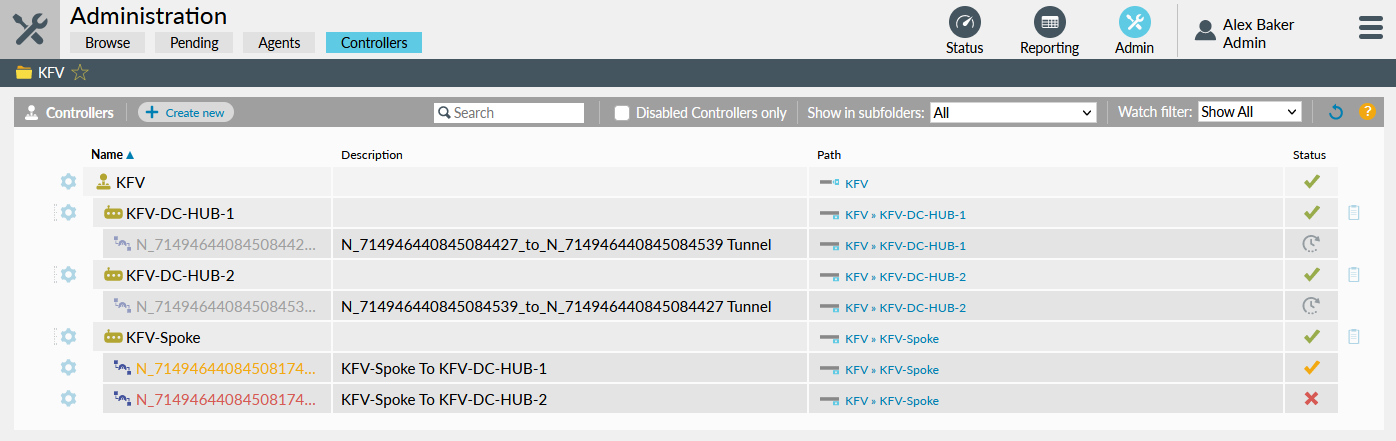
Released in Beta, Highlight’s SD-WAN offering automatically discovers devices and watches on your organisation's SD-WAN networks and places them in the correct location in the network explorer tree.
SD-WAN watches integrate into existing Highlight heat tile functionality and easy to understand graphics. SD-WAN watches alert when thresholds are breached and appear in reporting, enabling SLAs to be set and monitored for SD-WAN networks.
Contact us to participate in early trials. Find out more about SD-WAN.
Wallboard view- Highlight full screen mode
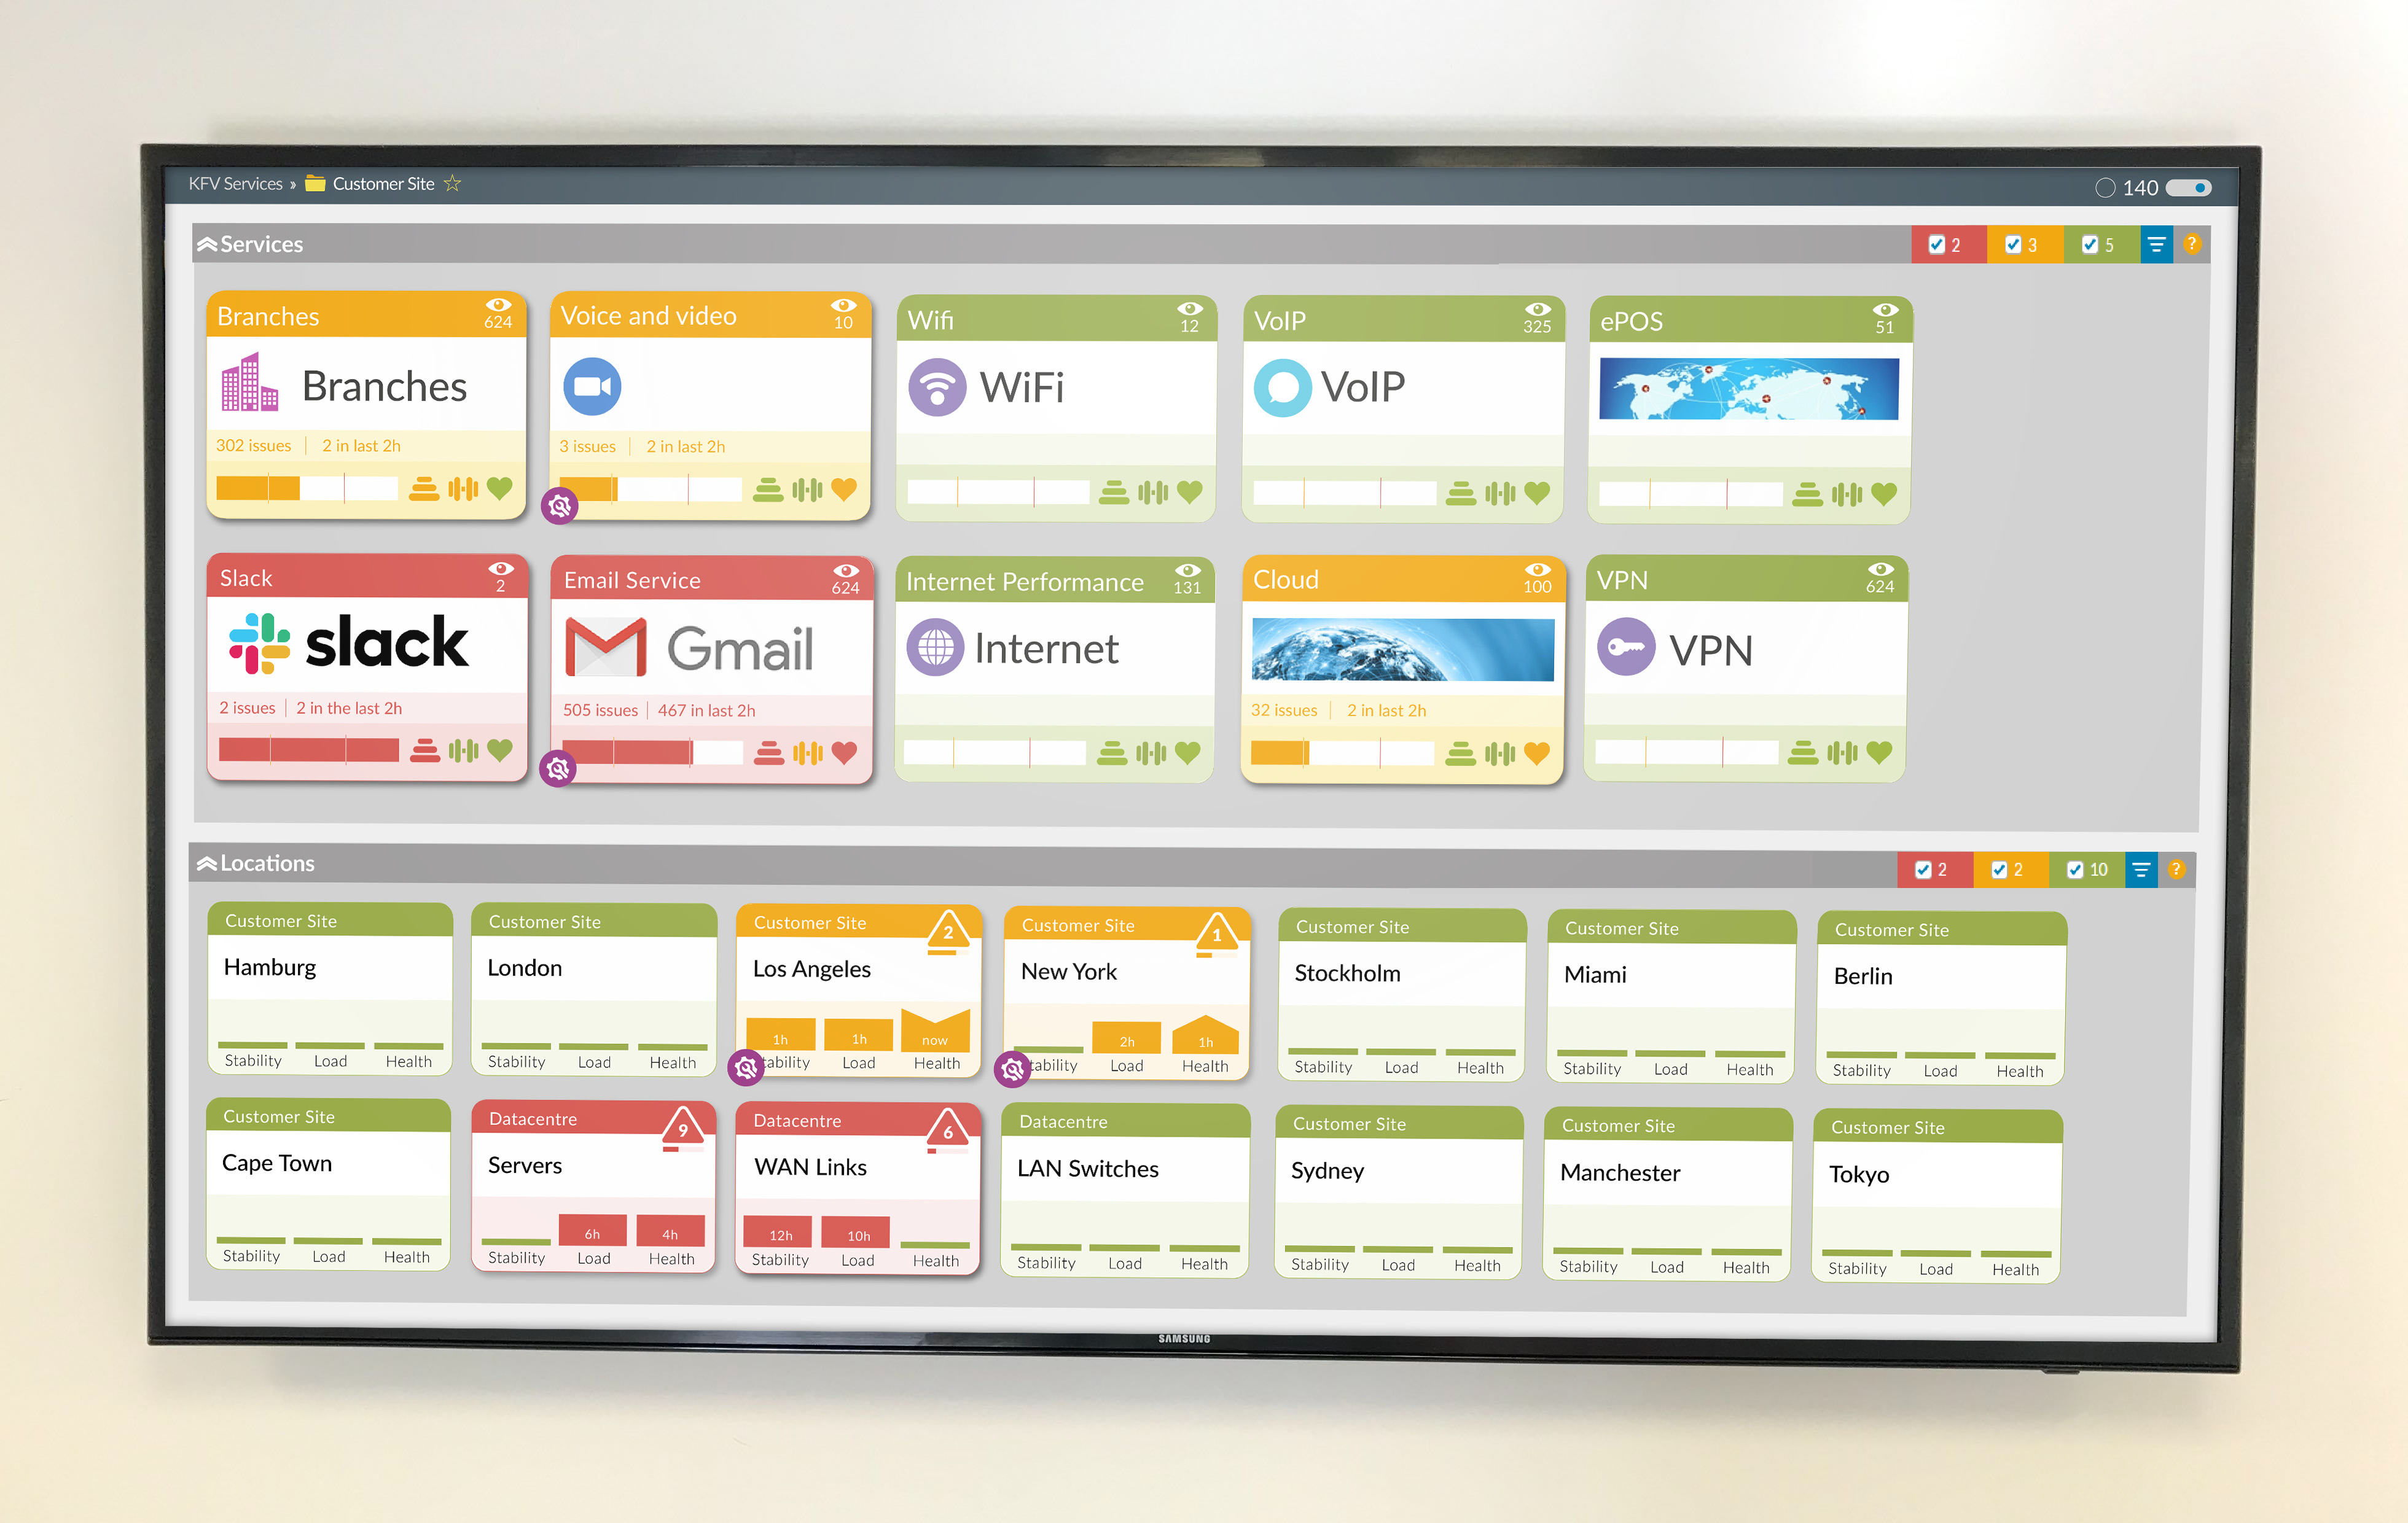
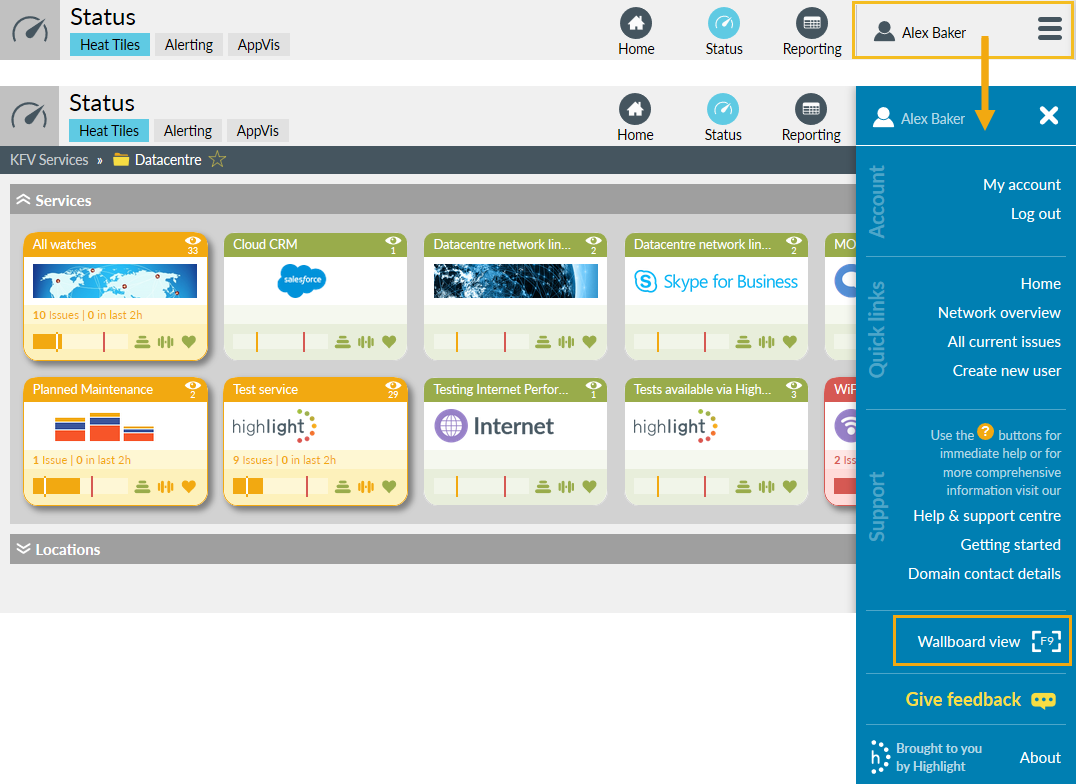
Collapse the tree and top navigation bar. Combine with F11 (on your keyboard) for a full screen view of Highlight, especially useful for continually displaying heat tiles on a NOC screen.
Find out more about wallboard view.
Other changes
Device restart results in red availability event
Highlight attempts to determine if loss of contact is a true outage or just a connection issue between the poller and monitored device. One method for this is by using the interface last change parameter. Previously when contact was re-established, if the device does not support the interface last change parameter then availability events were changed from mustard to blue (device not contactable). Blue events typically don't impact availability. Now when contact is re-established and there has been a system restart, the event will change to red to indicate a probable outage. Red outages decrement availability.
Aggregated ethernet interfaces on Juniper switches
When monitoring aggregated Ethernet interfaces on a Juniper switch which are bonded using LACP, Highlight autodiscovered the Ethernet sub-interfaces which do not provide an accurate aggregate of the traffic in use. Highlight now discovers and monitors the physical Ethernet interfaces instead, using Multilink autodiscovery.
Polling now defaults to use High Capacity (HC) interface counters
To avoid the "wrapping" of 32-bit counters measuring bytes in and out which occasionally causes spurious single spikes, Highlight now uses 64-bit counters by default to determine throughput. It will still use low capacity counters if the interface monitored does not support HC counters.
Bug fixes
- Reporting: if you do not run a network report having made selections, changing to another folder/location in the Explorer Tree no longer resets the selections to default
- TechTest: Highlight no longer spuriously reports SNMP ReadWrite is enabled.
To check for ReadWrite use Edit Watch Performance tab, Create new performance test, and Validate. - Traffic load download: the CSV download available from the Traffic Load charts on the Details page now shows a non-zero utilisation percentage if there is traffic present.
- Poller Validation: the poller no longer hangs if the local network is lost
- Edit folder parameters: this now works for Admin users created below a domain folder
- Audit log: the log now correctly refers to Alerts rather than list them as Actions
Browser compatibility
Highlight 20.4 has been tested on the following browsers:

Internet Explorer
Version 11

Firefox
Version 74.0 & ESR (68.6.0)

Chrome
Version 80.0.3987.149
Find out more about Highlight supported web browsers.
Get in touch
More details on all of Highlight’s features are available on the Help & Support Centre or contact us for assistance.