Release notes - November 2021
Summary
21.11 launches Highlight's Grid view plus SD-WAN overlay - Meraki VPN peers (tunnels)
Grid view
Highlight's Grid View offers a new way to view your locations and folders by categorising services into Underlay, Overlay and LAN columns:
- scan across rows to see the status of different services at a location
- scan down columns to see, at a glance, if issues are occurring with particular services
- sort by column to find the most recent issues
- use Group by folder to see multiple locations represented as a single folder - useful for service providers to quickly check on the status of many customers
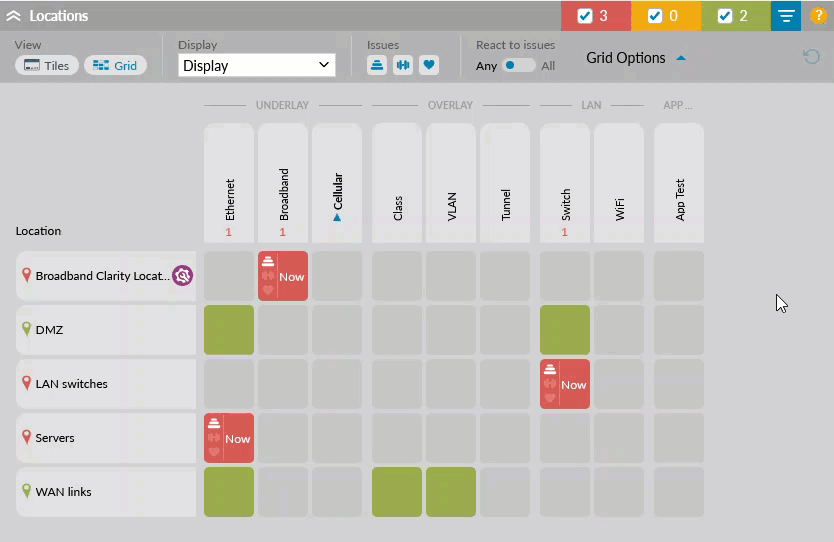
Rows
Rows in the grid are locations unless Group by folder is selected - then rows are either folders or locations. Click on a folder row to drill down to subfolders and locations. Click on a location row to open the strip chart panel showing all watches in that location.
Columns
Columns in the grid are services which might be available on a typical network and divided as Underlay, Overlay and LAN.
Cells
Cells may be one of 4 colours to indicate if watches of that type exist in the location or folder:
- Grey
- no watches
- Green
- watches exist and none have issues
- Amber/Red
- watches exist and some have issues
If there are watches with issues, the colour of the cell is determined by the Any/All toggle.
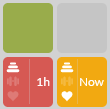
Cells with issues show the type of issues: stability, load, health or some combination of these and the duration of the most recent issue
Column headers
The column header shows the number of cells with issues in a column. Hover on the header to see the total cells.
Sorting
By default, the grid is sorted in alphanumeric order according to the first column, Folder/Location. Cells in a column are sorted by issue duration and then by Folder/Location if all other details match.
Find out more about grid view.
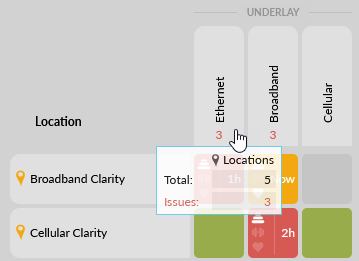
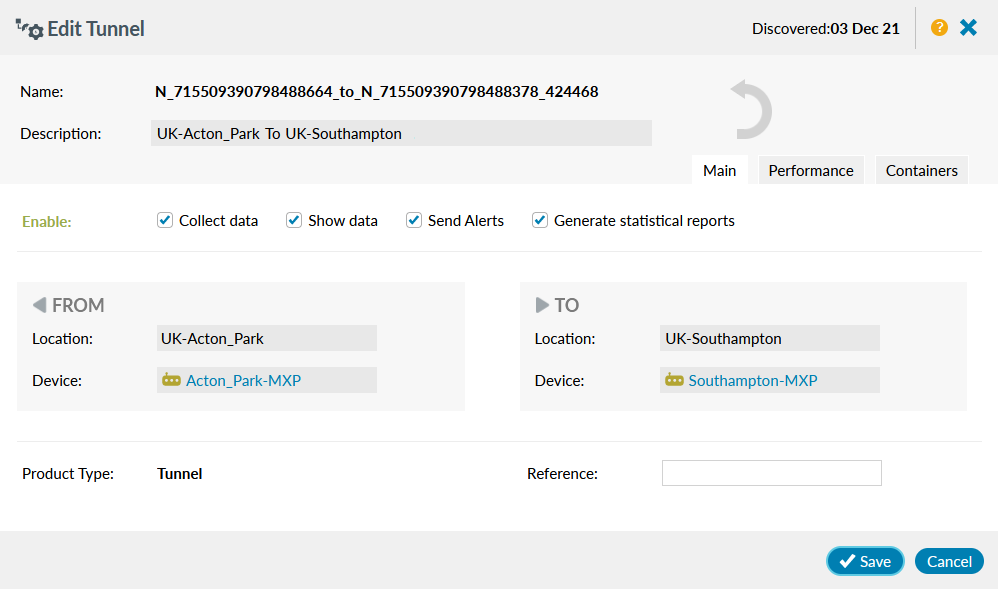
SD-WAN Overlay - Meraki VPN peer tunnels BETA
In 21.11 it's now possible to discover Meraki VPN peers. These are then displayed as tunnels throughout Highlight in:
- SD-WAN admin and edit
- Strip charts and dedicated Details pages
- Alerting
- Reporting
SD-WAN tunnels have an auto-generated description comprised of the FROM location and device description "To" the TO location and device description.
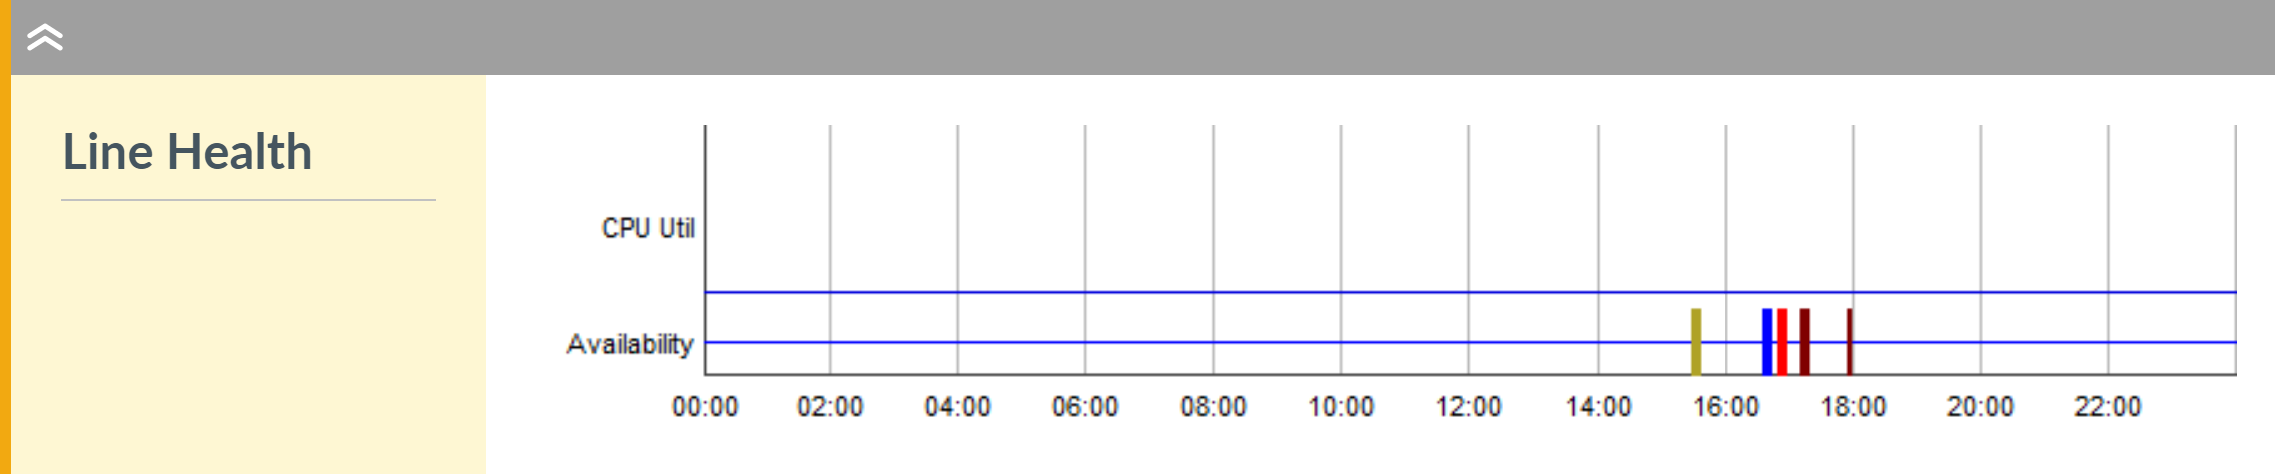
SD-WAN strip charts show blips on the Stability line, as the line health chart does. In the Status Heat Tiles page the strip charts for tunnels appear with bearers from the same device and are sorted by description. Bearers are first, followed by tunnels.
Blips indicate API call failures (ongoing and recovered), tunnel down or "discontinued".
It's possible to create "Tunnel-Availability" alerts and run reports specifically for tunnels which can include the parent device.
Find out more about:
Discontinued tunnels
Previously discovered tunnels may disappear from the SD-WAN network temporarily or permanently. Find out more about how discontinued tunnels are handled.
Agent down notification period can now be customised
The Highlight agent is responsible for collecting data from devices and third party APIs. As it's a critical function, Highlight sends two notification emails if a previously activated, enabled agent goes off-line or stops responding. With the release of 21.11, the time period for these notification emails can be adjusted down to 5 minutes.
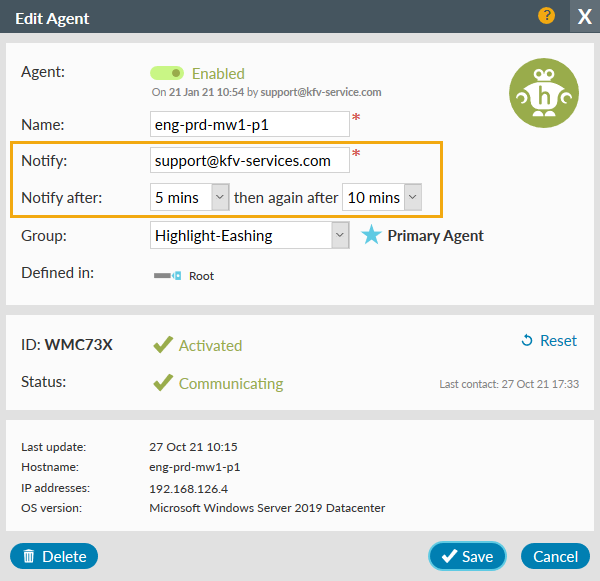
- Notify
- one or more email addresses (separated with a comma) to receive alerts from Highlight should this agent go off-line or stop responding.
This field is required and an actively monitored email address is highly recommended to ensure the agent gets prompt attention if down. - Notify after
- by default, alerts are sent after 30 minutes and again after another 30 minutes. This can be adjusted down in 5 minute intervals to receive quicker notification.
Find out more about agent notification.
Bug fixes
- WiFi: Fixed a Meraki WiFi failure caused when the API returned a duplicate access point MAC address
- WiFi: Performance improvements for Meraki API WiFI data collection following move to new Meraki dashboard API version
- Heat tiles: Duration of an issue shown on a strip chart now matches that shown on a heat tile
- Containers: Visibility is now set to Internal by default to reduce the likelihood of accidentally making containers visible to customer users
Browser compatibility
Highlight 21.11 has been tested on the following browsers:

Firefox
Version 93.0 & ESR (78.15.0)

Chrome
Version 95.0.4638.54

Edge
Version 95.0.1020.30
Find out more about Highlight supported browsers.
Get in touch
More details on all of Highlight’s features are available on the Help & Support Centre or contact us for assistance.