Release notes - July 2023
Summary
23.7 sees the launch of Reporting Insights, a graphical way to view reporting data and compare to previous months.
Reporting Insights
The latest trend: Highlight Reporting Insights
- View reporting data graphically
- Compare to previous months
- Display a table for additional details
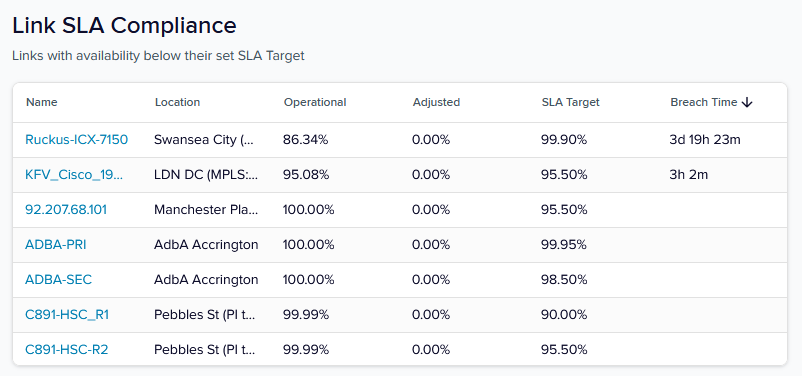
There are 7 different tiles available with Link SLA Compliance as an example below. Contact us if you'd like to change a tile or suggest a new tile.
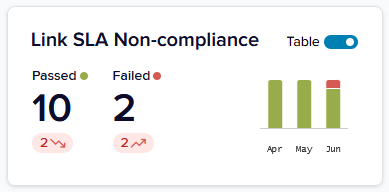
For the selected folder or location, see how many links passed and failed their SLA target.
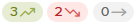
- The oval shows green if this is better than the previous month, red if worse and grey for no change.
Graphic: The columns show the selected month and the previous 2 months with green representing passes and red representing failures. You can hover on each column for details.
Table: Toggle to show a table with additional details and links to the details page for each watch.
Find out more about Reporting Insights.
Federated Authentication
Highlight supports multi-factor authentication and single sign-on through a process called Federated Authentication where password authentication is handed off to a third-party OAuth directory (typically Microsoft Azure AD).
In this release, there is the option to automatically create a new user in Highlight if that user has not previously logged in but has passed the authentication checks by the third-party provider. This is useful as new staff joining an organisation will be able to log into Highlight with no other admin intervention.
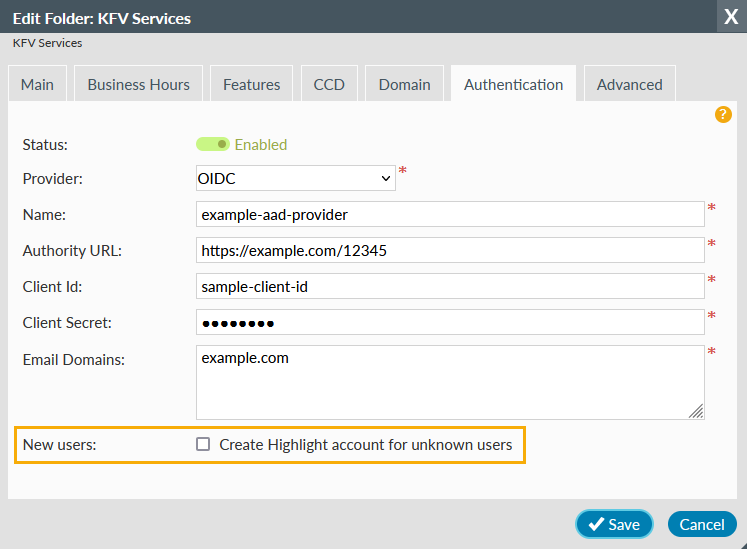
Auto-created users have the standard permissions (which include viewing heat tiles and details page, creating alerts and running reports). Extra admin permissions can be granted by other admin users if required.
Find out more about how admin users can set up authentication and contact us for assistance in setting up this feature.
Service description
The Highlight Service Description document concisely describes how Highlight works and its key features. It was updated for 23.7 and is available on the Help & Support Centre.
Browser compatibility
Highlight 23.7 has been tested on the current version of the following browsers:

Chrome

Edge

Firefox
Find out more about Highlight supported browsers.
Get in touch
More details on all of Highlight’s features are available on the Help & Support Centre or contact us for assistance.