Release notes 8.4
What's new?
Performance test templates
Create multiple tests quickly and consistently
Scheduled reports with links
Jump to watches directly from your inbox
Traffic load graphs by speed
Toggle between percentage and speed
Flow enhancements
Filter view by host/application; Flow in Admin watch report
1. Performance test templates
Following on from improvements made to performance tests in 8.3, we've now added performance test templates. Previously creating multiple performance tests involved entering each field manually, a repetitive process prone to human error. In 8.4, test templates speed up the process and improve the accuracy.
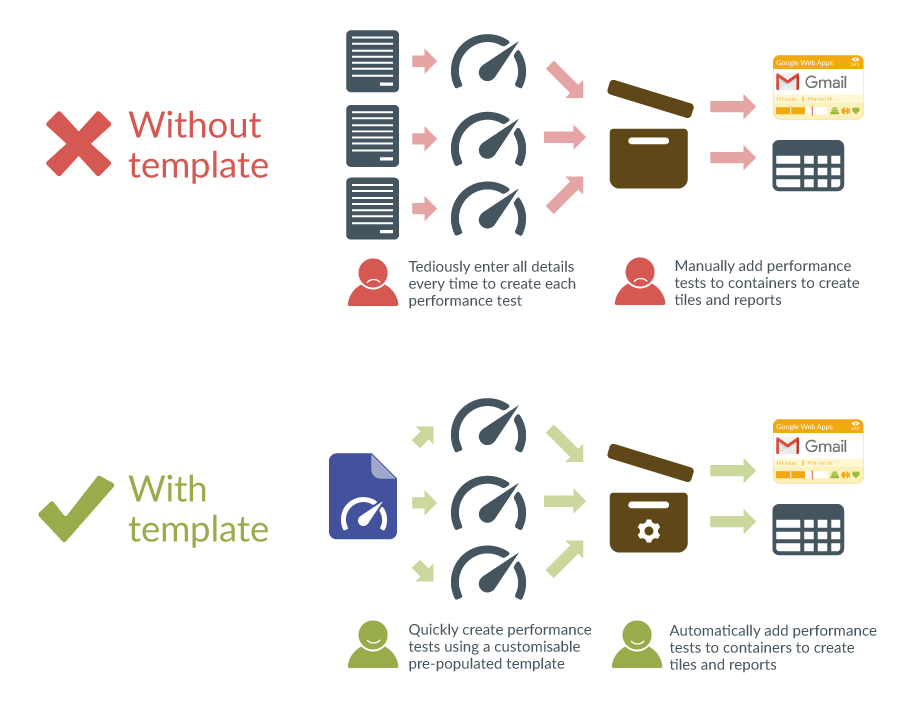
Test templates are created in a folder by admin users.

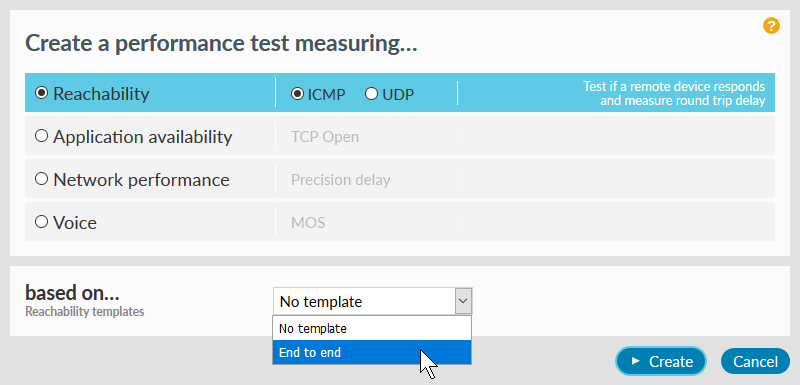
Once one or more test templates have been saved, when you then create a new performance test the dialog offers choice of one of the templates available for the selected test type.
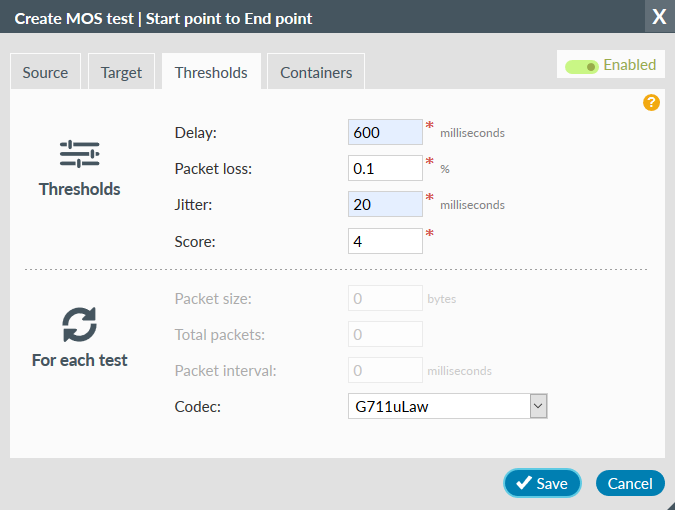
When creating a new performance test, fields with a blue background indicate which values have been applied from a template.
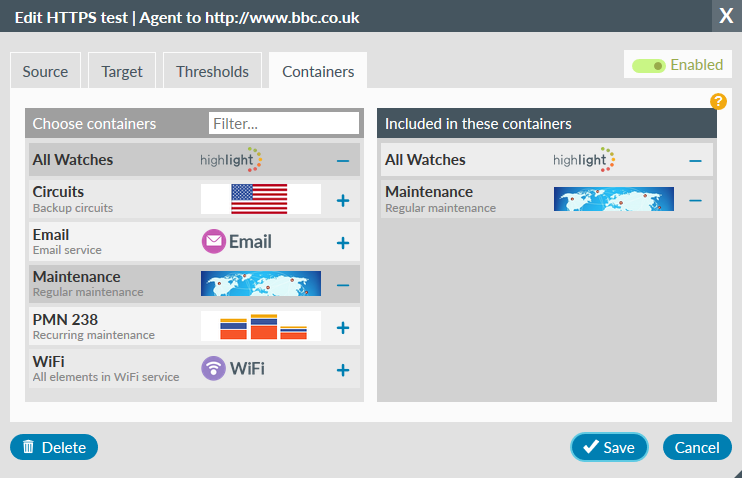
A template can be linked to one or more containers so all performance tests created with that template are automatically added to those containers.
Ultimately test templates combined with containers are the replacement for service definitions with service tests, which will be removed in a future release - see the Deprecated features section below.
Find out more about creating test templates.
2. Scheduled reports with links
In 8.4, we've added links to your scheduled reports. When a report arrives in your inbox you can follow the links to view the Details page for each watch in the report.
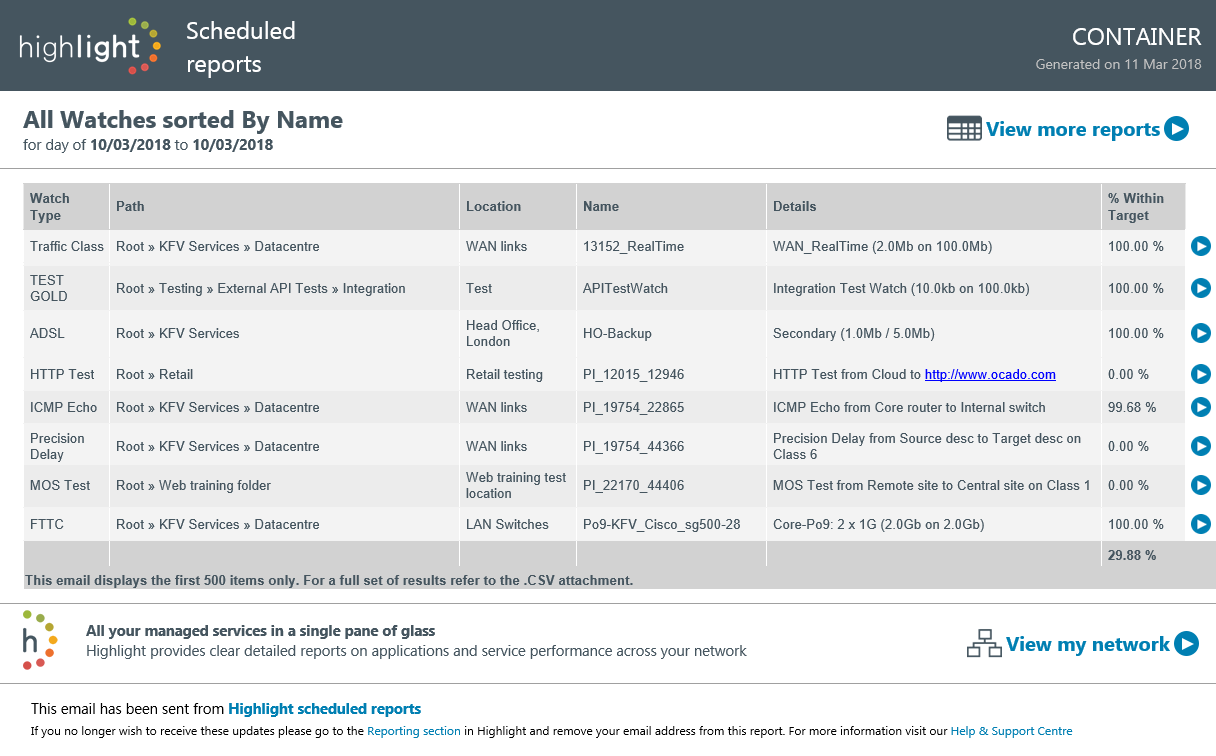
Find out more about setting up a scheduled report.
Have you ever wondered which reports to schedule in Highlight?
Refer to our list of suggested reports for answers to common requests such as:
- "Show me the top 20 circuits which are bursting beyond service speed" - Burst report
- "Show me all circuits which have had an outage" - Availability report
- "Show me what equipment I have in Highlight" - Hardware list/serial numbers/licences
- and more....
3. Traffic load graphs by speed
You can now toggle between percentage and speed in bps. This is useful for circuits with variable or unknown line speed where bps is a more relevant unit of traffic load.

Read more about traffic load.
4. Flow enhancements
Flow graph enhancements on the Details page
For the selected time period (day, week or month), a Flow graph shows the top 20 hosts/applications (plus others grouped together) either sending or receiving traffic.
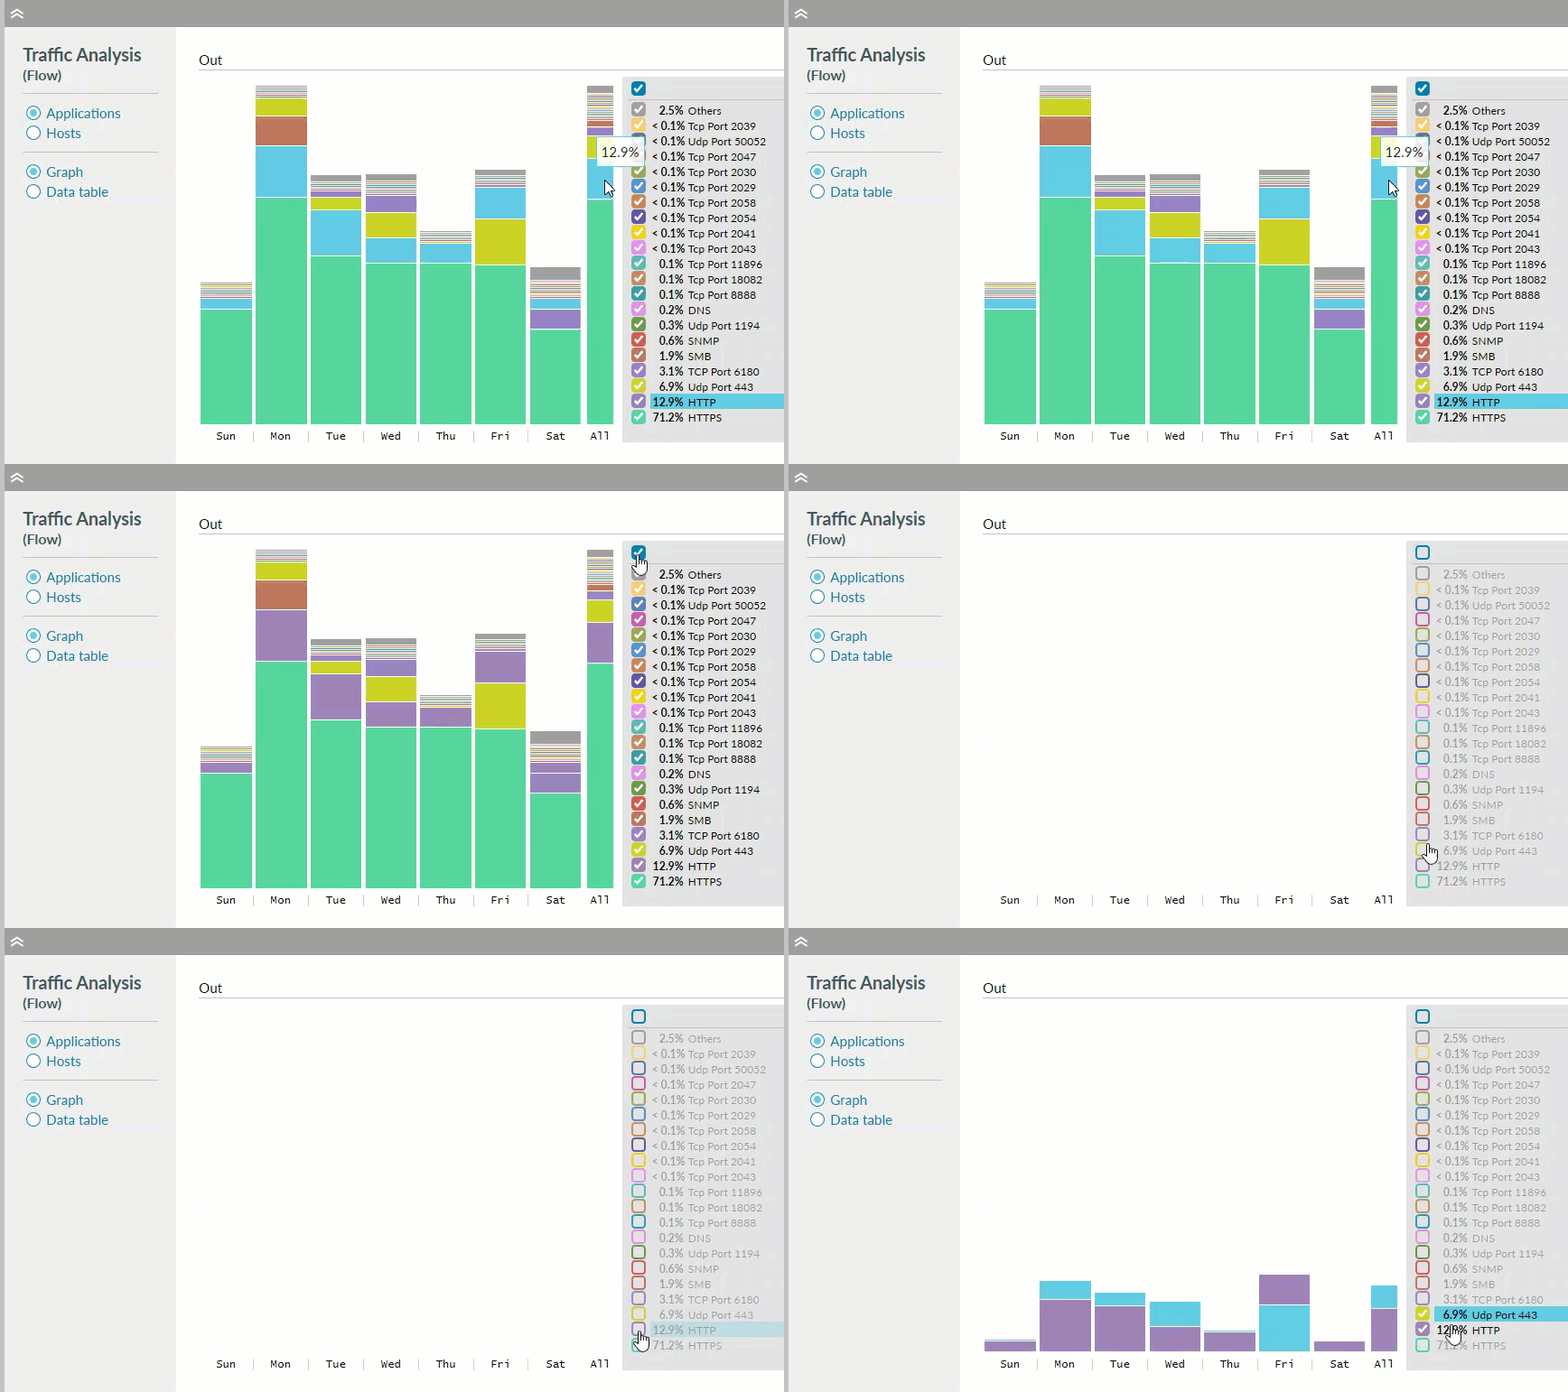

- hover over each coloured section to see the percent of total traffic used by that host/application during the selected time period. The host/application name is also indicated in the list.
- uncheck a host/application to remove it from the graph, check only those of interest.
Read more about Flow.
Flow watches in Admin watch report

The watch report now includes all Flow watches for the selected folder and when the Last Good Sample was received. Thus this report can be run to confirm that Flow watches are still working as expected, and to identify any that are not, for Flow troubleshooting purposes. Note: the user permission View Admin reports is required to run the watch report.

Read more about watch reports.
Other changes
- Devices that do not support ifDescr will now validate if they have ifName instead, for example Fortigate
- Admin browse shows watch name, bandwidth, product type and description as separate areas on the line.
- "Your account is about to expire" emails are now sent automatically at 14 days and 2 days prior to expiry, with another email sent just after expiry
- Multiple pollers can be assigned to a folder allowing an alternative poller to be selected on bearer watches. This is a preparation step towards future Highlight developments.
- The software to set up a Highlight Agent on a server can now be downloaded from the Admin Agents header bar
- In line with General Data Protection Regulation (GDPR), we've added in various small changes to show how we store your data
Deprecated features
Services and service tests are to be replaced by containers and performance test templates.
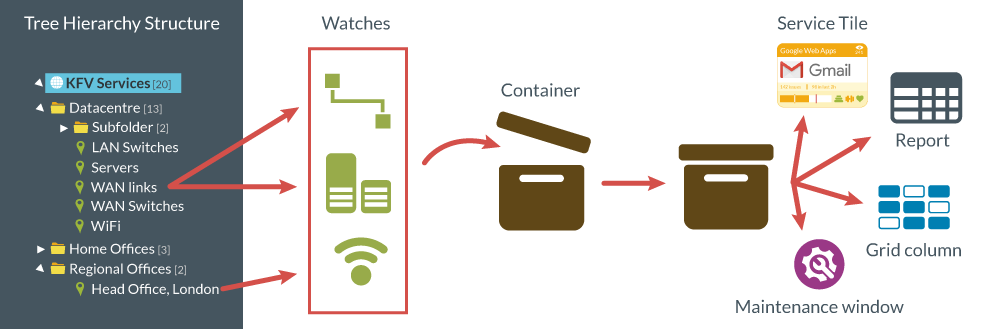
A service tile is now created using a container, allowing all previous functionality and more:
- Improved workflow
- Streamlined user interface to create service tiles
- Set thresholds
- Change tile colour based on the number of watches with issues
- Test templates
- Quickly create multiple performance tests
- Maintenance windows
- Temporarily stop watches generating alerts or affecting heat tiles
Legacy service tiles will be removed and converted into the new container based service tiles in a future release of Highlight. We recommend using containers for any new tile. Find out more about containers.
In a future release of Highlight, any existing service test will be replaced with a performance test and the service test feature will be removed. Find out more about performance test templates.
Bug fixes
- A poller temporarily reverting to SNMP v1 will now automatically recover to SNMP v2c if available
- Jitter is now correctly calculated for fewer than 6 results per sample for ICMP/TCP/UDP
- Any private report templates are now deleted when a user is deleted from Highlight
- Users with only "View Admin reports" permission no longer have an Admin button
Browser compatibility
Highlight 8.4 has been tested on the following browsers:

Internet Explorer
Version 11

Firefox
Version 59.0.2 & ESR (52.7.3)

Chrome
Version 66.0.3359
Find out more about Highlight supported web browsers.
Get in touch
More details on all of Highlight’s features are available on the Help & Support Centre or contact us for assistance.