Reporting Insights
Overview
Refer to the Insight UI Help & Support - Reporting Insights page for details on this page.
Report tiles give an overview of the performance of the selected month compared to the previous and earlier months. Use the calendar control to select a different month. Use the Reporting Tile Options panel to choose which tiles are shown.
- Reset date selection returns the calendar control to the most recent complete month
Table
Use the Table toggle to show or hide the table of data which accompanies each report tile. Common features for the table are:
Table details
- When the table is showing, seven rows of data appear, with a scroll bar if there's additional data.
- If applicable, then the text in the first column is blue. Clicking on this cell opens the details page for the watch for the selected month.
Sorting the table
- The table is sorted by one column as indicated by the arrow.
- Reverse the sort order by clicking the column header
- Sort by a different column header by clicking on another column header.
- A secondary sort option is available by holding Shift on the keyboard and clicking a second column header.
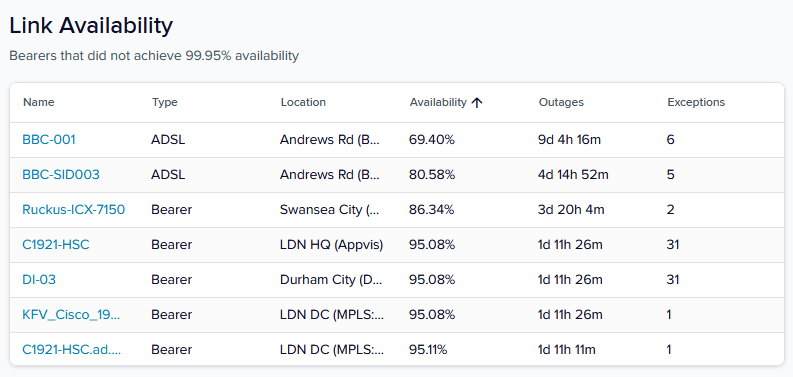
Tile: Link Availability
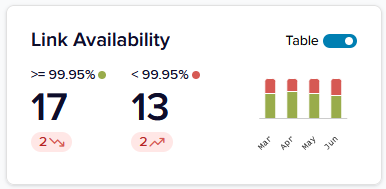
Pass: The left number totals the number of bearers achieving availability of 99.95% or more. The oval shows red if this a decrease in passes on the previous month, green for an increase and grey for no change. Hover on the oval for additional detail.
Fail: The right number totals the number of bearers achieving availability of less than 99.95%. The oval shows red if this an increase in failures on the previous month, green for a decrease and grey for no change. Hover on the oval for additional detail.
Graphic: The columns show the selected month and the previous 3 months with green representing passes and red representing failures. Hover on each column for details.
Table: The table shows only those watches below the threshold (99.95%) and sorts by the worst availability percentage at the top.
Tile: Busy Links
Refer to the Insight UI Help & Support - Reporting Insights: Busy Links tile for details on this tile.
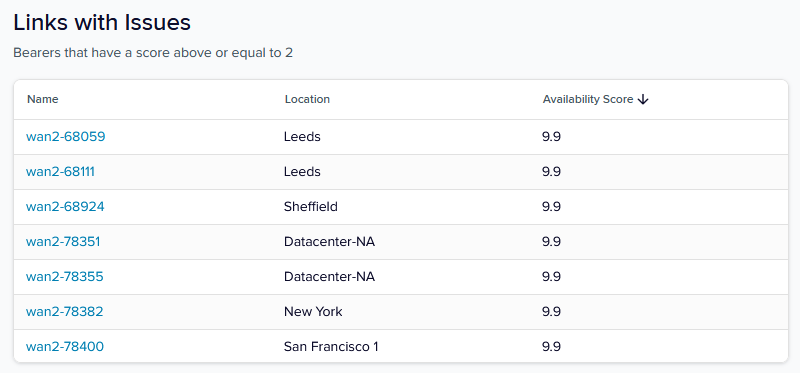
Tile: Links with Issues
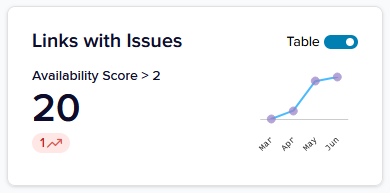
For the folder or location selected, this tile counts the number of bearers with an issue score of 2 or more. The oval shows red if this an increase on the previous month, green for a decrease and grey for no change. Hover on the oval for additional detail.
Graphic: The line chart shows the selected month and the previous 3 months. Hover on each data point for details.
Table: By default, the table shows the highest issue scores at the top.
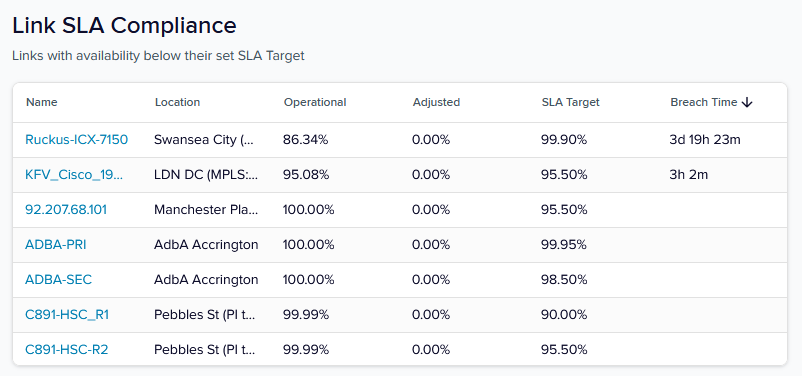
Tile: Link SLA Non-compliance
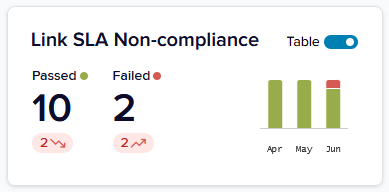
Pass: The tile considers which watches have an SLA Availability Target set, and then calculates how many were above their target. The oval shows red if this a decrease on the previous month, green for an increase and grey for no change. Hover on the oval for additional detail.
Fail: The tile considers which watches have an SLA Availability Target set, and then calculates how many were equal to or below their target. The oval shows red if this an increase on the previous month, green for a decrease and grey for no change. Hover on the oval for additional detail.
Notes:
Adjusted exclusions are taken into account.
Watches without an SLA Availability Target set are not considered.
Only bearer watches are included.
Graphic: The columns show the selected month and the previous 2 months with green representing passes and red representing failures. Hover on each column for details.
Table: The table sorts watches with the highest breach in time at the top and shows all watches for the folder or location selected, even those which have achieved their SLA.
Tile: Site SLA Non-compliance
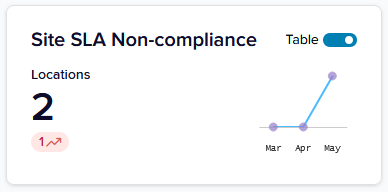
Pass: The tile considers locations that have a Site Availability SLA Target set and then calculates how many locations were above their target. The oval shows red if this is a decrease on the previous month, green for an increase and grey for no change. Hover on the oval for additional detail.
Fail: The tile considers locations that have a Site Availability SLA Target set and then calculates how many locations were equal to or below their target. The oval shows red if this is an increase on the previous month, green for a decrease and grey for no change. Hover on the oval for additional detail.
Notes:
Only applicable to locations with a site SLA set.
Refer to Editing a location - Site availability for details on setting a site SLA.
Refer to Site availability for details on setting a watch as a site link.
Only bearer watches are included.
Graphic: The line chart shows this month and the previous 3 months. Hover on each data point for details.
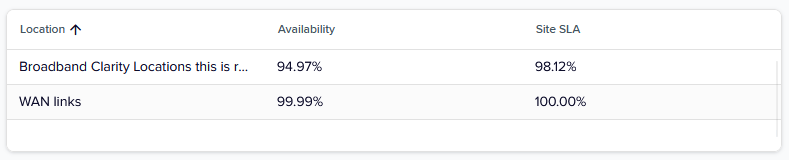
Table: The table shows locations which failed their SLA for the month selected and for the folder or location selected.
Tile: Outage Duration Total
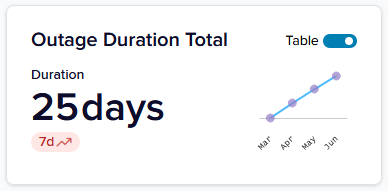
Totals the outage time for the bearers over the period for the selected folder. The figure shows the most significant unit of time (day, hour, etc.). The oval shows red if this an increase on the previous month, green for a decrease and grey for no change. Hover on the oval for additional detail.
Graphic: The line chart shows the selected month and the previous 3 months. Hover on each data point for details.
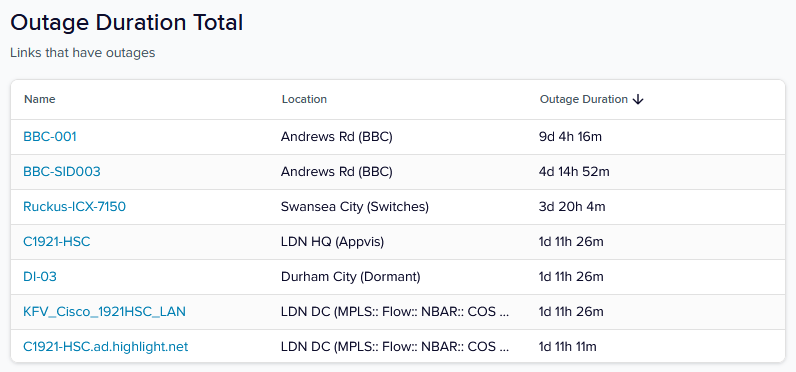
Table: The table shows only those bearers with an outage, sorted to show the longest outage at the top.
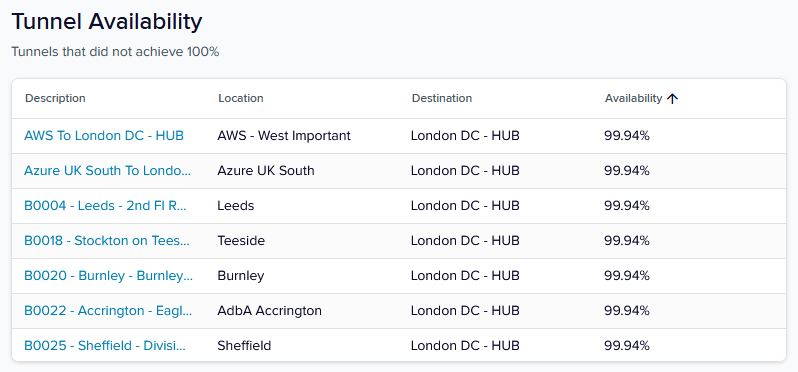
Tile: Tunnel Availability
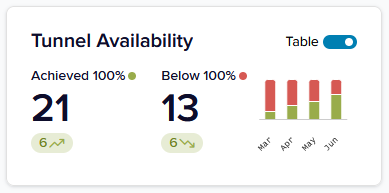
Achieved 100%: The left number is the number of tunnel watches that have achieved 100% availability. The oval shows red if this a decrease on the previous month, green for an increase and grey for no change. Hover on the oval for additional detail.
Below 100%: The right number is the number of tunnel watches that have NOT achieved 100% availability. The oval shows red if this an increase on the previous month, green for a decrease and grey for no change. Hover on the oval for additional detail.
Graphic: The columns show the selected month and the previous 3 months with green representing passes and red representing failures. Hover on each column for details.
Table: The table shows only those watches below the threshold (99.95%) and sorts by the lowest availability percentage at the top.
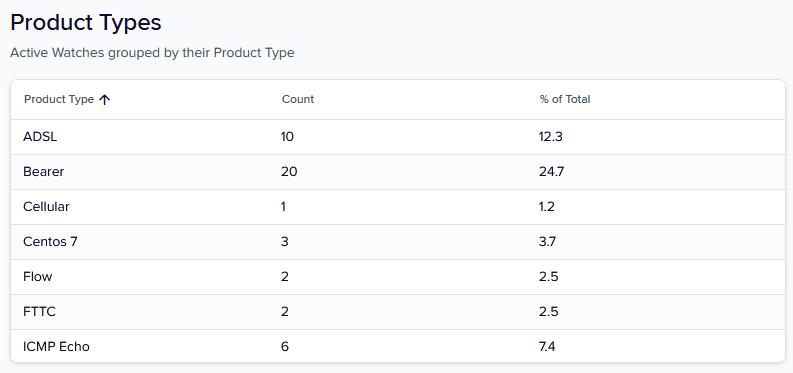
Tile: Product Types
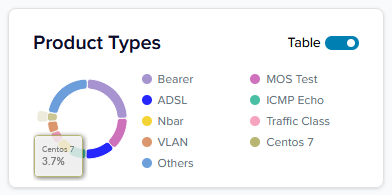
Counts watches by Product Type. The first 8 Product Types are shown with the rest grouped as Others. All Product Types are listed in the table.
Graphic: Hover on each section for details.
Table: Sorted alphabetically by Product Type by default and can be sorted on any column.
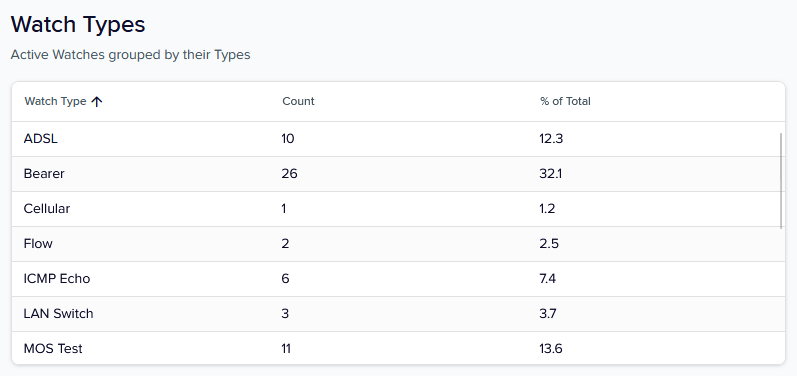
Tile: Watch Types
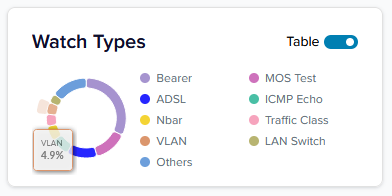
Counts watches by Watch Type. The first 8 Watch Types are shown with the rest grouped as Others. All Watch Types are listed in the table.
Graphic: Hover on each section for details.
Table: Sorted alphabetically by Watch Type by default and can be sorted on any column.
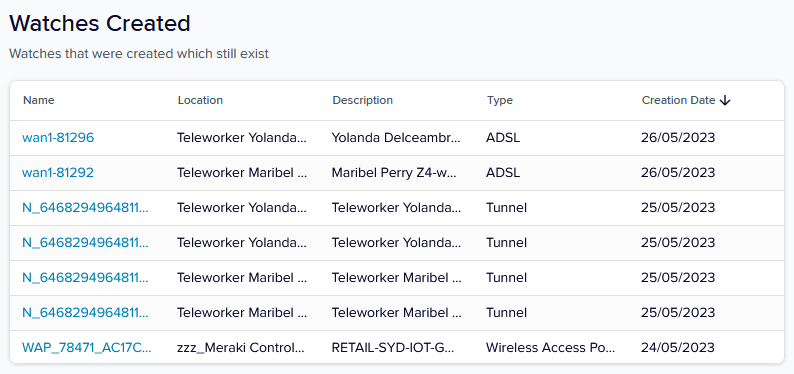
Tile: Watches Created
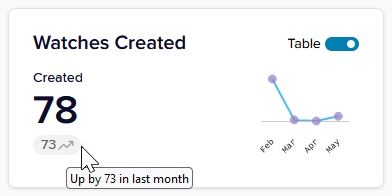
Totals the number of watches that still exist that were created in the time period selected. The number on the right (after /) is the total number of watches in scope. The oval shows if this an increase or decrease on the previous month.
Graphic: The line chart shows this month and the previous 3 months. Hover on each data point for details.
Table: Sorted with the most recent created first for the selected month.
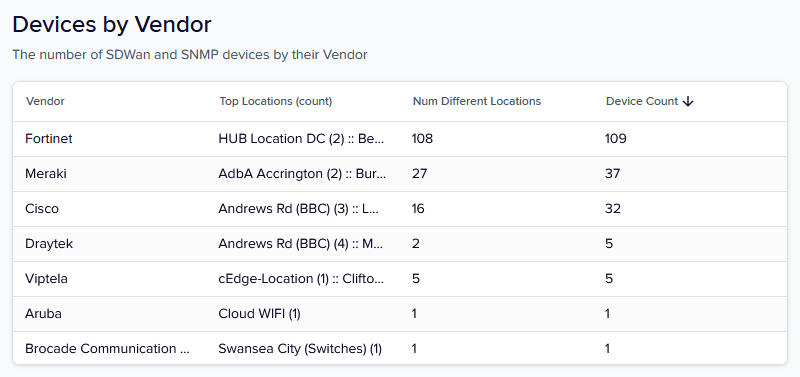
Tile: Devices by Vendor
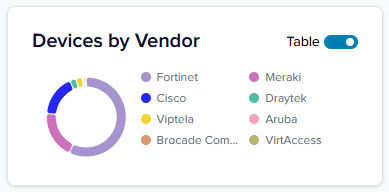
This tile takes a snapshot of the existing tree (folders and subfolders), scans the number of SD-WAN and SNMP devices and groups them by their vendor name. For each vendor the tile shows the number of devices used and how many different locations in which they appear.
Graphic: Hover on each section for details.
Table: The table shows on the top three locations for each vendor and the device count for each location in brackets.