Grid view
Overview
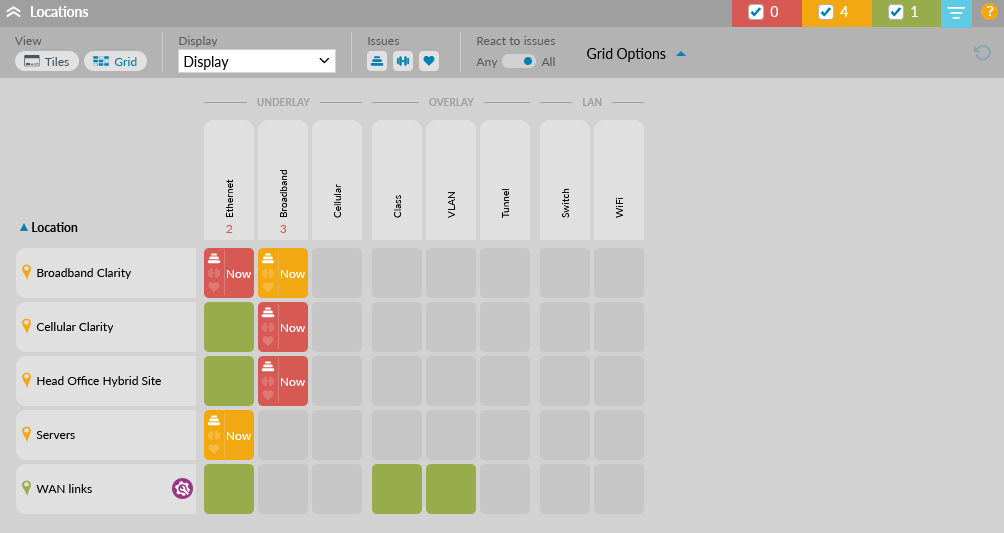
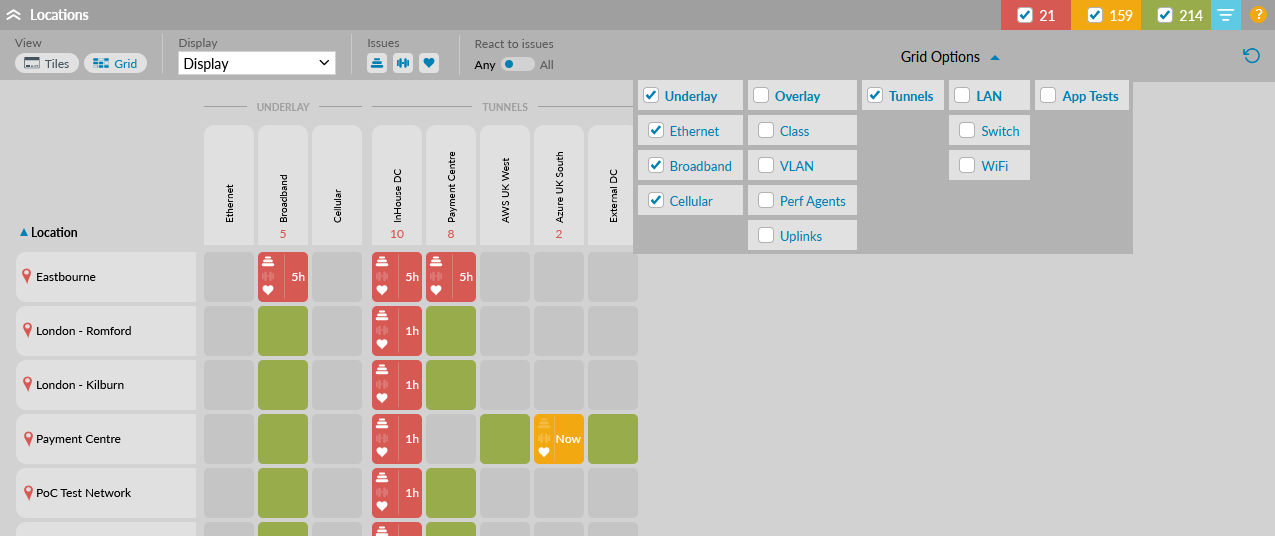
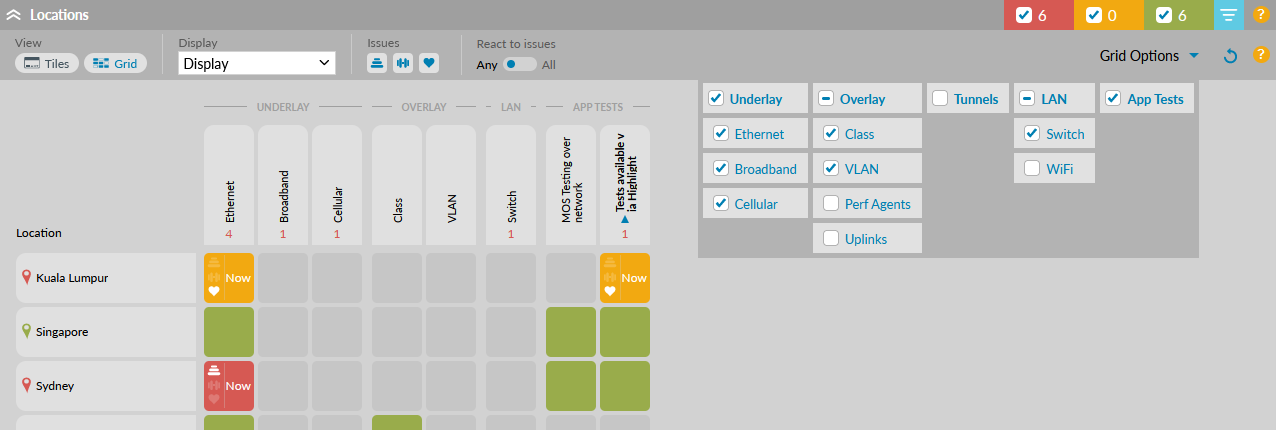
Available for locations only, see your services in a grid with underlay, overlay and LAN services in their own section.
Display options
Refresh Options
The Status Heat tiles page refreshes every 180 seconds by default, with auto refresh on.

Alternatively, switching auto refresh off will keep the page in view constant until you select a different position in the network explorer tree.
Use the options panel to group or filter rows.
- Open the options panel using the button.
- When the options panel is open the button changes to bright blue. If you close this panel, it will be closed when you next log in.
Reset all filters - If any settings have changed from default, the "Reset all filters" button is enabled. These options revert to default when you next log in but tile size remains as previously set.
Locations

View
Tiles and Grid buttons are available if grid view has been enabled on the selected folder in the tree. Otherwise, the buttons are hidden and you see location tiles only.
- By default show location tiles - find out more about tiles view
- Optionally view locations in a grid
Your selection of Tiles or Grid will be remembered when you next log in
Display
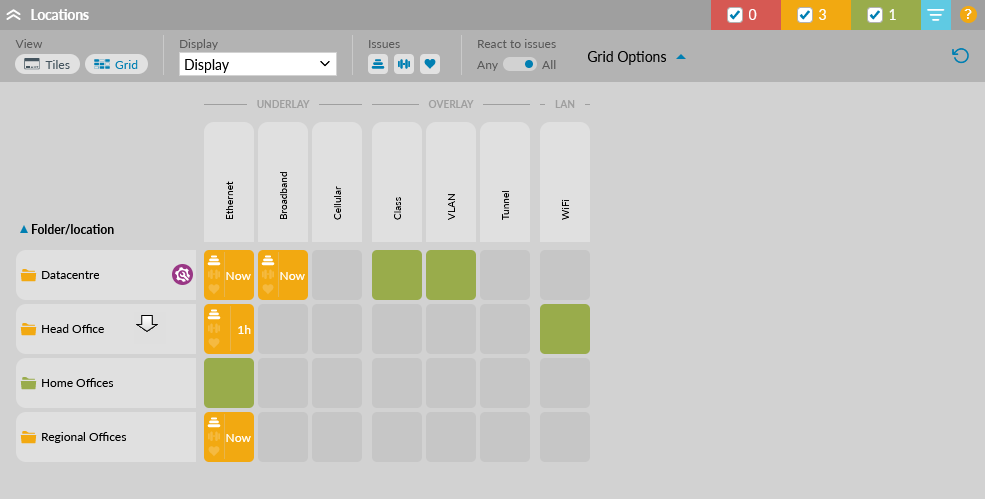
Group by folder
All locations below the folder selected in the tree are shown unless this option is checked. Multiple locations are shown as a single folder which simplifies the view for large networks. The overall number of issues is shown and can be filtered by stability, load or health. Click a folder row to drill down to subfolders and locations. The state of this checkbox is remembered for the rest of the session but resets to unchecked when you next log in.
Hide empty columns
If a column in the Grid is empty (meaning it contains no watches) then check this option to hide the column. Navigating to another location or folder in the tree may unhide a column if it then contains watches. The state of this checkbox is remembered when you next log in.
Issues
By default, all issue types are shown: stability, load and health. Use these icons to hide or show one or more issue types. These buttons have no effect on green rows.
React to issues: Any or All
Refer to the section below for details on these options.
Grid options
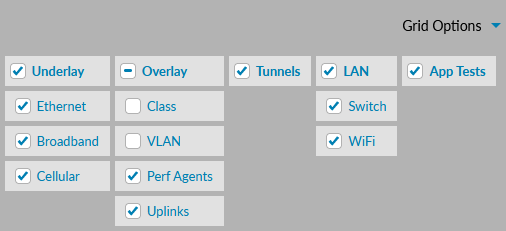
Use the Grid options drop-down menu to manually hide columns. Use the top checkbox to remove an entire section: Underlay, Overlay, Tunnels, LAN or App Tests. These options are remembered for the rest of the session but reset to the default (all columns showing) when you next log in.
- Indeterminate
- A line in any top checkbox indicates a mix of checked and unchecked sub-checkboxes
Grid details
Rows
Rows in the grid are locations unless Group by folder is selected - then rows are either folders or locations. Click on a folder row to drill down to subfolders and locations. Click on a location row to open the watch status panel showing all watches in that location.
- a green icon indicates no issues with any watches within the location or folder
- if watches have issues, the colour of the location pin or folder is set by the state of the Any/All toggle, see section below
- if a row has one or more watches in maintenance, an indicator is shown. Hover shows the total number of watches in maintenance and the text "Contains N watch(es) in maintenance."
Columns
Columns in the grid are services which might be available on a typical network and divided as shown below. If Hide empty columns is checked, only columns with watches are shown.
UNDERLAY
- Ethernet
- dedicated access bearers and any performance tests on the bearers
- Broadband
- ADSL and SDSL bearers (which do not have a switch subwatch)
- Cellular
- SNMP bearers with Cellular Clarity enabled or SD-WAN cellular uplinks
OVERLAY
- Class
- all Classes of Service and any performance tests on the classes
- VLAN
- VLANs and any performance tests on the VLAN
- Uplinks
- SD-WAN uplinks and any associated performance tests, see SD-WAN Uplinks in the Grid section below
TUNNELS
- Tunnels
- SD-WAN tunnels and any associated performance tests, see SD-WAN Tunnels in the Grid section below
LAN
- Controller Status
- Controller status watches show the state of the controller itself
- Perf Agents
- Performance agents and any associated performance tests
- Switch
- all switch parent bearers and switch watches
- WiFi
- all Wireless Access Points
- IoT
- all cameras and sensors
APP TESTS
- App Test
- containers with "Show as App Test column" enabled on the Grid tab, container description (if available, otherwise container name) is shown as the column header, see App Tests in the Grid section below
Cells
Cells may be one of 4 colours to indicate if watches of that type exist in the location or folder:
- Grey
- no watches
- Green
- watches exist and none have issues
- Amber/Red
- watches exist and some have issues
If there are watches with issues, the colour of the cell is determined by the Any/All toggle, see section below.
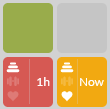
Cells with issues show the type of issues: stability, load, health or some combination of these and the duration of the most recent issue shown as:
- Now
- for under 1 hour or
- h
- for hours, from "1h" up to "47h" or
- d
- for days, from "2d" up to ">30d"
Column headers
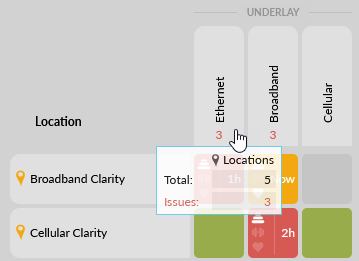
The column header shows the number of cells with issues in a column. Hover on the header to see the total cells. This is not available when Group by folder is selected.
Sorting
By default, the grid is sorted in alphanumeric order according to the first column, Folder/Location, and is not case sensitive.
- click on a column header to sort by that column or reverse the order;
a blue indicator shows which column the grid is sorted on
Cells in a column are sorted by issue duration and then by Folder/Location if all other details match.
Row colours displayed

- A count of rows in each state (red/amber/green) is displayed in the panel header at all times and adapts to the Any/All and Group by folder settings.
Use the check box below or click on each colour to hide or show those rows in the display. Reset all filters - The "Reset all filters" button returns colour settings to their default
The display resets to show all colours each time you log in.
React to issues: Any or All
Watch-centric (React to issues: Any)
With this default setting, cells and rows in the grid view change colour based on the worst case of any single watch in the category or location. This view enables service provider operations teams to quickly see areas with issues to be resolved but can occasionally result in a sea of red cells and rows for relatively minor issues.
With Any selected on the "React to issues" toggle, cells and rows are:
- Grey
- For cells only, no watches in this category in this row
- Green
- No issues
- Amber
- Some watches are in a transitional (amber) state
- Red
- Some watches are in a degraded (red) state
Location-centric (React to issues: All)
Highlight provides an alternative view which is based on the location (or folder) as a whole, rather than on any single watch. In this view an amber row indicates a location with degraded connectivity which is still online. This view is beneficial to enterprises and service providers wanting a higher-level overview of the entire network.
With All selected on the "React to issues" toggle, cells and rows are:
- Grey
- For cells only, no watches in this category in this row
- Green
- No issues
- Amber
- Some watches have issues and some are green, or all watches are amber
- Red
- All watches have issues with at least one red
- Any All
- This setting is remembered when you next log in

- The count of rows in each state (red/amber/green) adapts to the Any/All setting
SD-WAN Uplinks in the Grid
SD-WAN uplinks and any associated performance tests are shown in the Uplinks column with the following exceptions:
- Cellular - if the uplink has a cellular child watch, or Meraki call the interface 'cellular', it is shown in the Cellular column in the Underlay section
- Site Link Broadband - if the uplink has "site link" enabled AND the bandwidth up and down values differ, it is shown in the Broadband column in the Underlay section
- Site Link Ethernet - if the uplink has "site link" enabled AND the bandwidth up and down values match, it is shown in the Ethernet column in the Underlay section
Find out more about site links.
SD-WAN Tunnels in the Grid
Performance tests are shown in the Grid column with their parent tunnel.
If the selected folder in the tree is a customer folder and contains SD-WAN tunnels, then Highlight expands the single Tunnel column to show all destination locations. The same applies to locations if their parent folder is set to customer visibility.
At a glance, you can quickly see
- if a location has issues with some or all destinations or
- if a hub has issues with some or all its locations
Find out more about SD-WAN tunnel "To" locations.
App Tests in the Grid
If the selected folder in the tree is a customer folder and includes a container with Show as App Test column enabled, then Highlight shows the container as a column in the Grid.
If the selected folder in the tree is an internal folder and includes one or more containers with Show as App Test column enabled, then Highlight shows a single aggregated column called "App Test" in the Grid.
- Only the status of performance tests is included even if the container includes other watch types.
- Performance test are duplicated in the Grid appearing both in the Underlay or Tunnel section and in the App Tests section if included.
Find out more about the Grid tab on a container.