Hybrid WAN
Overview
In order to improve efficiency, some networks are now set up to share traffic across two or three separate networks based on application, load and other factors. The options might be a private, more expensive MPLS link and the public internet but they could also be any links. In this network configuration, smart routers continually analyse the available paths and route traffic based on the more cost effective option. Highlight's Hybrid WAN feature gives you visibility of which route is being used when and by which applications.

Hybrid WAN information in Highlight
Status
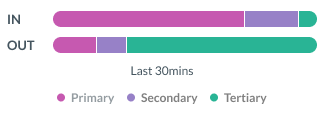
When clicking a location tile with two or three Hybrid WAN links, a balance chart showing the split of traffic on the routes for the last four hours appears above the strip charts for the location. The times on the chart are in UTC. . The description for each bearer is shown or alternatively the watch name is shown. Hybrid WAN links are shown in alphabetical order by description (if available) so Primary, Secondary and Tertiary circuits show in order with consistent colours.
- Primary (pink)
- Secondary (soft purple)
- Tertiary (teal)
Traffic in Traffic out You can toggle the chart to show traffic in or out from the location.

Traffic Analysis
If Flow is enabled for the Hybrid WAN links, click the chart or this button to open a detailed view in a new window, see the Hybrid WAN dialog section below.
Reporting

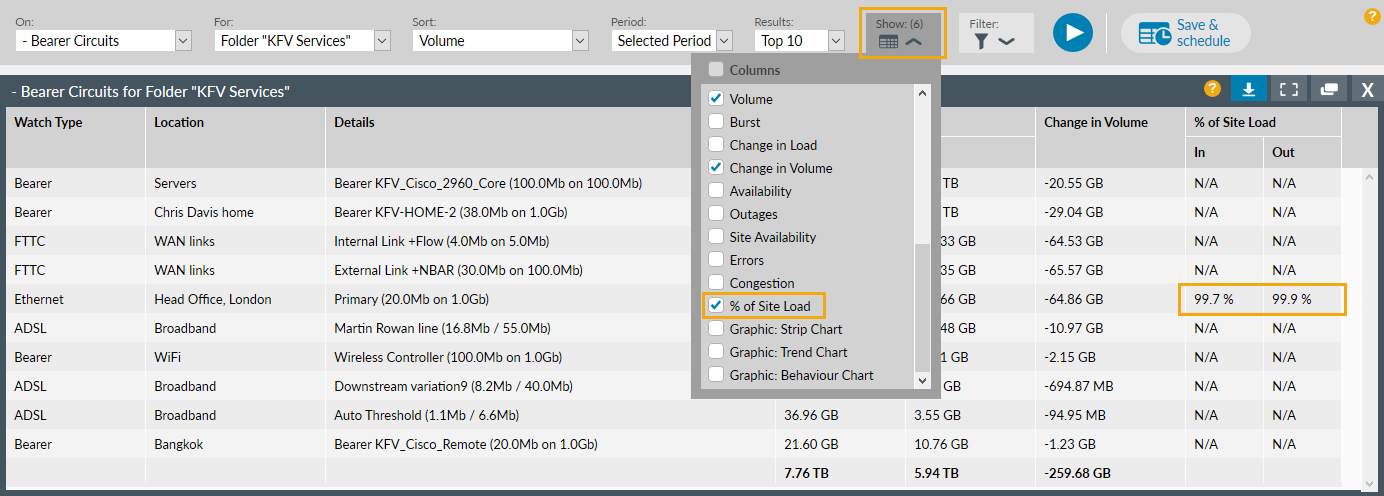
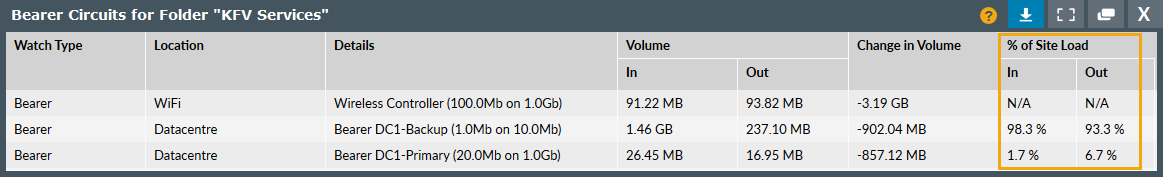
There's an option under Show: (N) for % of Site Load which shows the breakdown of total traffic over the selected date and time period. This column will show N/A if the bearer is not a Hybrid WAN link.

Hybrid WAN dialog
For comparison, this dialog shows the breakdown of applications or hosts sending traffic on the two Hybrid WAN links at this location then displays the top 20 applications (plus others grouped together) with outbound traffic on the left, inbound on the right.
Highlight collects Flow data from compatible devices such as Cisco, Juniper, or Riverbed.
The flow data is presented in UTC rather than in the location's timezone.

Options
Calendar control
The time period (day, week or month) and date can be changed using this control

Applications Hosts
Applications:
show the top 20 applications (plus others grouped together) running across the selected link, or
Hosts:
show the top 20 hosts (plus others grouped together) either sending or receiving traffic
Graph Data table
Switch between graphical and text views of the information using the buttons provided. Displaying text results in a data table has the option to break the data down further (by hour on a day view, day on a week view, and week on a month view).
Data table
If you select Data table, there is a further option to view a list of the top ten conversations involved with the entry.
