Watch Status Panel
Overview
A watch status card is a summarised view of a watch. Clicking on the card opens the watch Details page.
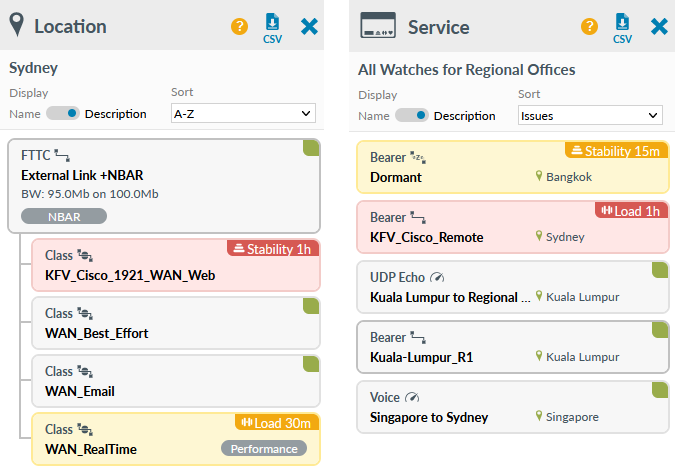
Watch status cards appear when you click on a heat tile or grid row.
Panel header
Depending on whether a service or location was clicked, the panel header shows one of the icons below and the name or description, if available
- Location
- Service
Display
Name Description
All watches have a name and a description is optional. If no description is configured, the watch name shows regardless of the status of this toggle. The option of Name or Description is remembered when you next login.
Sort
There are 3 options available for sorting: A - Z, Issues or Type. The selection is remembered when you next login.
- A - Z
- Watches are sorted by alphabetically by description
- Issues
- Sorting by issues puts the most recent amber and red watches at the top followed by green watches, which are sorted by description
- Type
- This sorts the list by watch type and then by description
Order for Services:- Controller Status
- Bearers
- Tunnels
- Classes
- VLAN
- MLE
- Performance tests
- Switches
- WAPs
- Cameras
- Sensors
Order for Locations:
- Controller Status
- Bearers (non SD-WAN)
- Classes
- VLAN
- MLE
- SD-WAN (grouped under parent device)
- Bearers
- Tunnels
- Switches
- WAPs
- Cameras
- Sensors
Download a CSV list of all watches linked to the service or location with real-time information. The CSV file shows: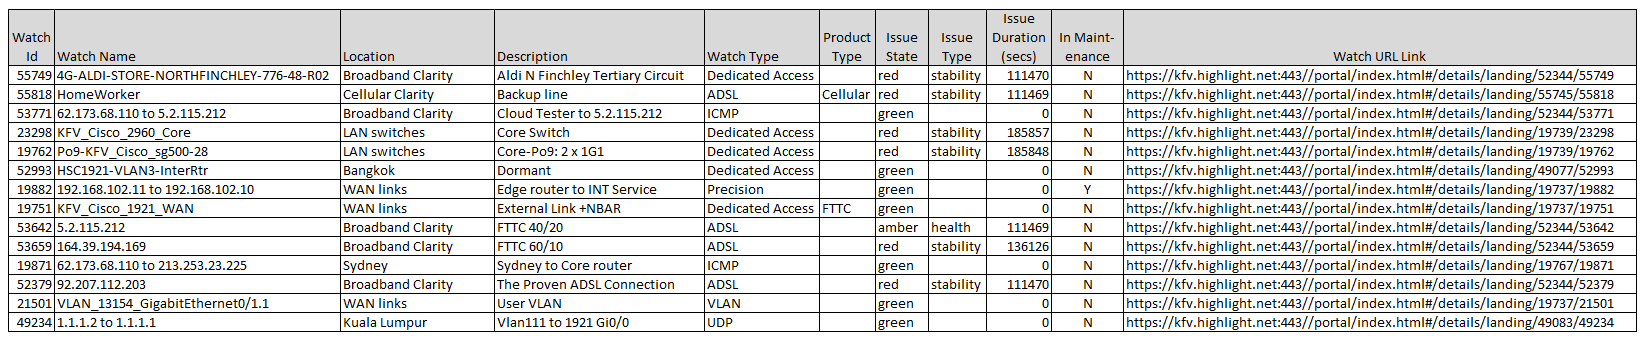
- Watch Id
- a unique identifier for each watch
- Watch Name
- defined by a Admin user or auto-generated at discovery
- Location
- this is the Highlight location of the watch and useful for service tiles
- Description
- optional field on a watch which displays instead of the watch name elsewhere in Highlight
- Watch Type
- show the type of watch or performance test, for example: ADSL, Tunnel, Precision
- Product Type
- optional field on a watch which displays instead of the watch type elsewhere in Highlight
- Issue State
- red/amber/green, this is the current state of the watch with green indicating no issue
- Issue Type
- stability/load/health for the most recent issue on the watch and empty for watches in a green state
- Issue Duration (secs)
- duration of the most recent amber or red issue in seconds and 0 for watches in a green state
- In Maintenance
- yes or no, watches in maintenance do not send alerts, change the colour of heat tiles nor decrement availability figures
- Watch URL Link
- following the URL opens the details page for the watch
Card details
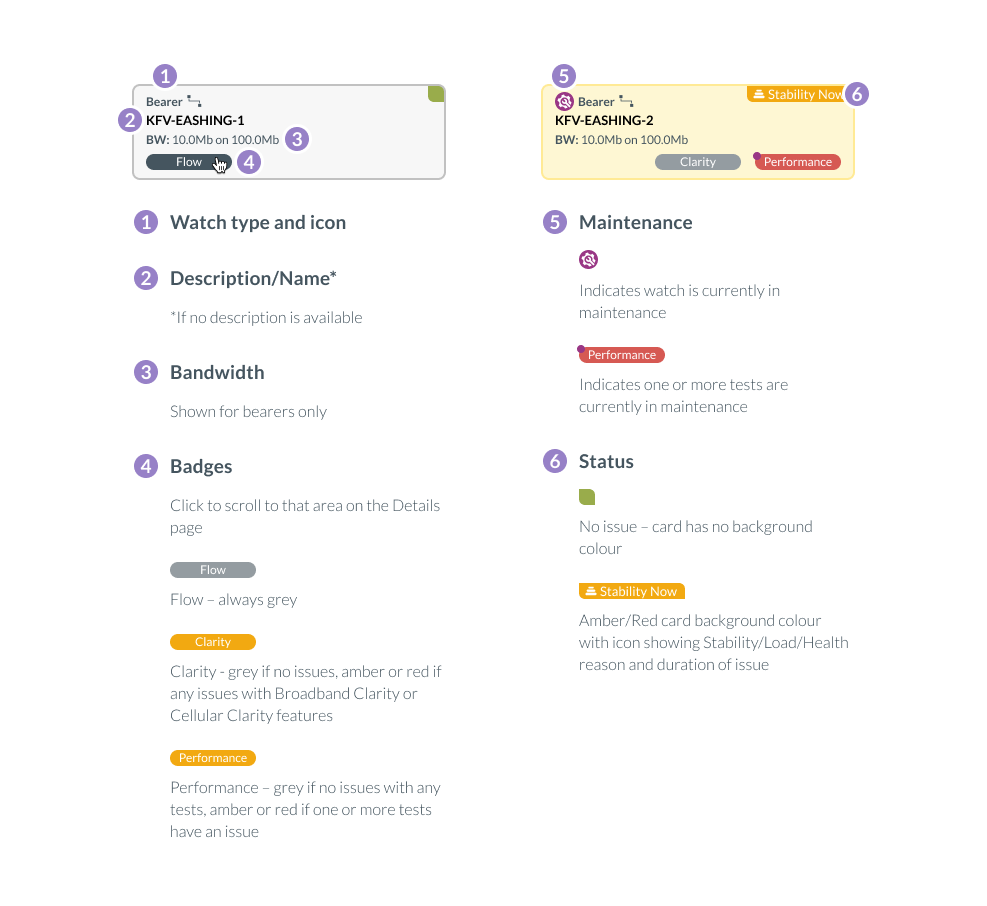
Icons indicate watch type:
- for Controller Status watches
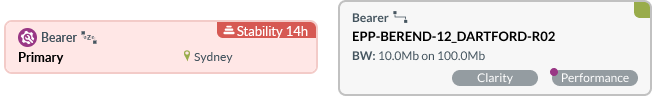
- for bearers
- for bearers with an interface marked as dormant
- for classes, VLANs and MLEs
- for SD-WAN tunnels
- for performance tests
- for switches
- for Wireless Access Points (APs)
- for cameras
- for sensors
Duration:
Red and amber cards show a duration in minutes (m), hours (h) or days (d). This is the duration of the most recent issue on the watch.
Badges:
Watches with additional features show a badge in the lower part of the card. Click the badge to jump to that section of the watch details page.
- Flow
- Shown if the watch has either Flow or NBAR
- Clarity
- Shown if the watch has either Broadband Clarity or Cellular Clarity in a green state (no issues)
- Performance
- Shown if the watch has one or more performance tests and all are in a green state (no issues)
- Clarity Clarity
- The Clarity badge changes to amber or red if either Broadband Clarity or Cellular Clarity have an issue
- Performance Performance
- The Performance badge changes to amber or red if one or more tests on the watch have issues
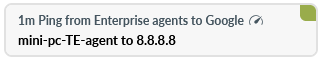
For performance tests which are discovered via API,
the test name on the third party system is shown instead of the test type
Maintenance
If the watch is in maintenance, the maintenance icon is shown. On hover this shows "Watch in maintenance".
If one or more performance tests is in maintenance, a purple dot shows on the Performance badge.
Cards still show colour changes to amber and red when in maintenance but this does not impact the associated heat tile colour.
Watches in maintenance do not send alerts, change the colour of heat tiles nor decrement availability figures
Hybrid WAN chart
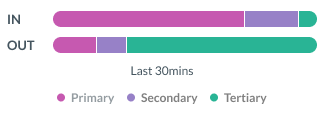
Find out more about Hybrid WAN.