Troubleshooting Line Availability
Overview
This page explains symptoms experienced with the Line Availability chart
Symptom 1. Availability shows constant orange Brief Outage
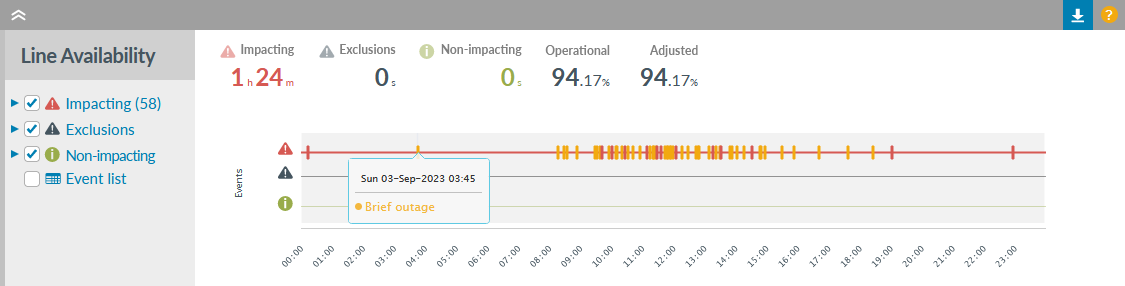
Description
This issue will present in Highlight as a solid orange bar on the Impacting line of the Line Availability chart.
Background
- Cisco bug reference CSCty73897
(old bug number CSCsh93041)
The issue stems from a Cisco bug which affects the ifLastChange MIB (.iso.3.6.1.2.1.2.2.1.9). This MIB value is checked every time Highlight polls the router for data and the bug causes this MIB value to creep up (it should only change if the interface has had a state change).
Knock-on effect in Highlight
The Traffic graphs show zero load.
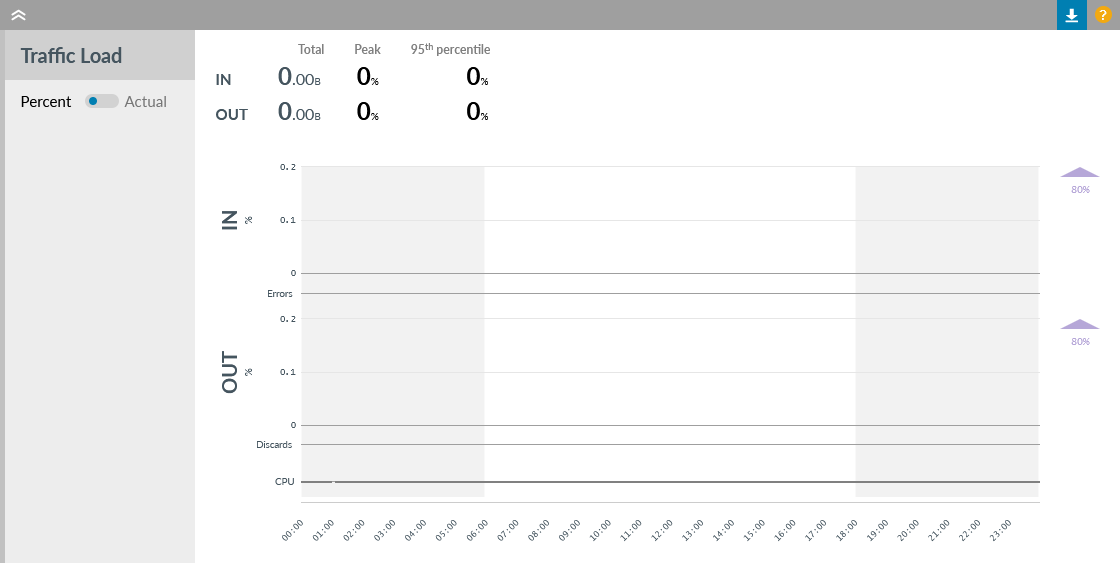
This is due to Highlight interpreting the interface state changed between polls. Highlight therefore does not know over what time period to average the polled traffic figures so results are discarded as being unreliable.
Fix
The only fix for this is to change the IOS version (either newer or older). See the bug reference on the Cisco website for a list of IOS versions known to be affected, and also a list of IOS versions without this bug.
Identifying devices affected
Using Highlight it is usually possible to obtain a list of affected devices. Run a report by selecting Reporting and the Network tab, then:
Select the appropriate folder from Network Explorer tree
View by: a recent complete week
On: "Bearer Circuits"
Sorted By: "Availability"
Show Me: at least Path, Location, Name, Volume, and Availability
Filter on Availability Exceptions. Remove any text filter or Business Hours.
Results: All Results
For devices polled every 3 minutes, extract and check those with 66.6% -66.7% availability and zero bytes in and out. If required the report can be downloaded as a CSV. Find out more: reporting.
Symptom 2. Ongoing or unknown event
This issue will present in Highlight in the following way on the Line Availability chart:
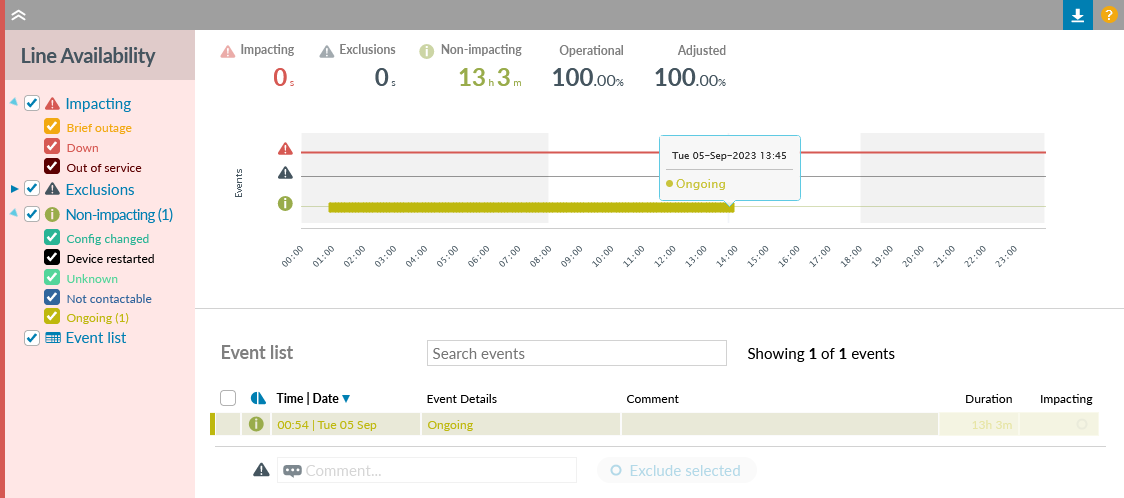
To troubleshoot non-responding devices, follow the same process as for new devices.
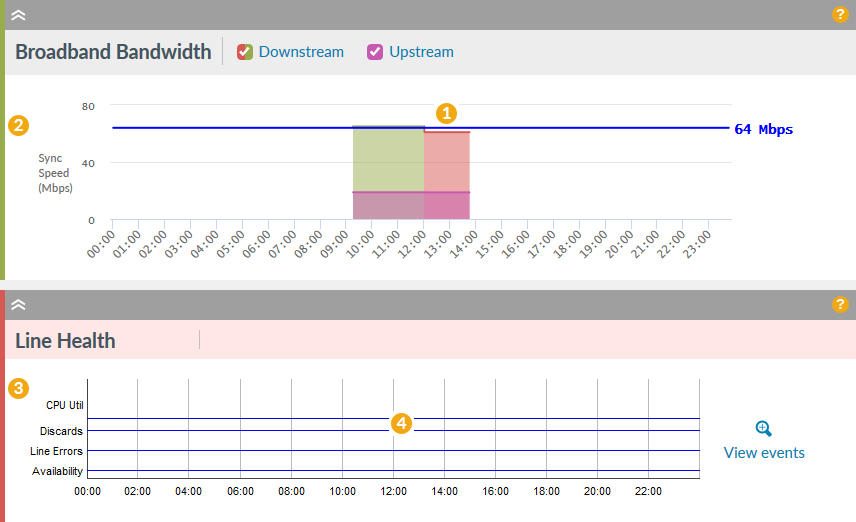
Symptom 3. The watch goes red with no apparent issues
Broadband watch low speed
Broadband issues are indicated on the Line Health chart rather than the Broadband Bandwidth chart.
Consider the image below...
The Broadband speed dropping below threshold (1) resulted in the Broadband chart remaining flagged as green (2) but caused an issue on the Line Health chart flagged as amber/red (3), even though there were no corresponding events when you click on the Line Health chart (4).
Watch not contactable from one poller
If a watch is contactable from one poller but not from its partner, this can result in the watch going red even though traffic and interface stats continue to be gathered. Contact your Service provider to see if that is the case.
Watch is red for stability and fails to clear
If this happens, a possible fix is uncheck Collect data, save then check Collect data again.