Creating Containers
Overview
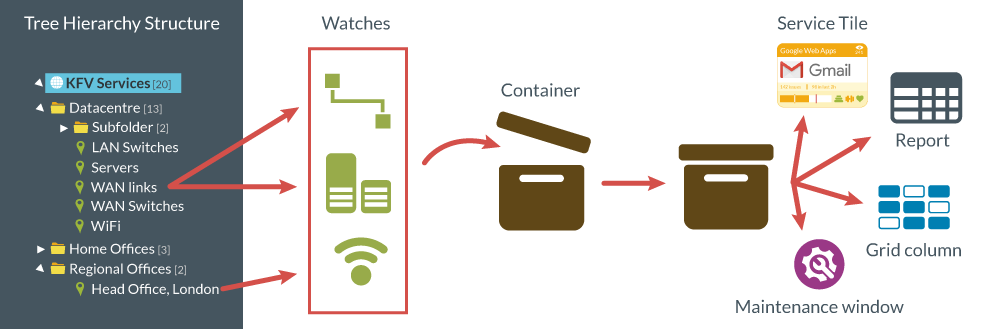
A container is a flexible grouping of watches. Any watches available under the container's position in the tree can be added. Once created, a container can be:
- Displayed as a service tile
- The basis of a report
- Set for recurring or one-off maintenance
- Displayed as a column on the Grid (showing the status performance tests only)
Permission needed: Edit watches (to show a container as a heat tile on the Status page) or Manage maintenance (to set a container as a maintenance window). If you have both permissions, you will see three tabs: Watches, Tile and Maintenance.
Create and edit a container
Select the relevant folder from the Network Explorer panel.
From the Admin tab, click Browse, click + Create new... and select Container.
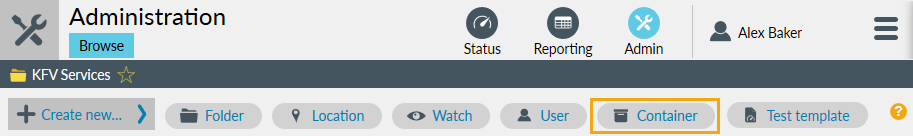
The following dialog appears. The fields are explained below.
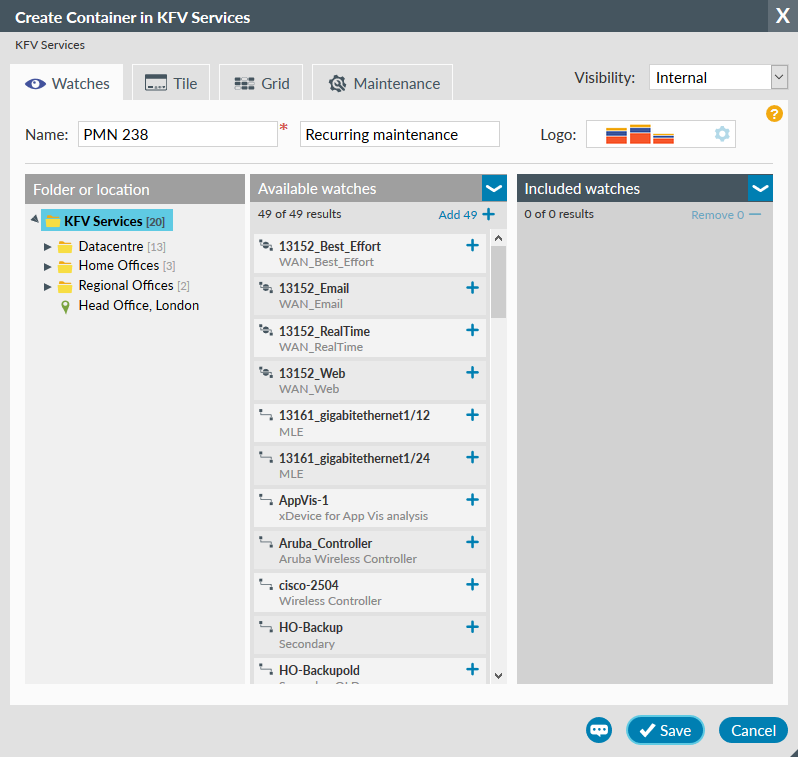
The three fields of Name, Description and Logo are available from both the Watches and Tile tabs.
- Name
- Enter the container name (a required field), which may be up to 100 characters and must be unique in the folder. The name will be displayed for a watch during a period of maintenance defined by this container.
- Description
- This is an optional field, displayed in Highlight in place of the container name and limited to 100 characters.
- Logo
- See the currently applied logo or click to change it, see Logo Management section below for full details
- Visibility
- This option (only shown if you are a service provider) determines if the container/service tile is visible to all users, or just to service provider internal staff. There are two options:
- Customer:
- anyone can see the container
- Internal:
- only internal service provider users can see the container (this is the default)
- Click this button to record a comment in the Audit log against updates for this container. An input box expands to the left and comments can be up to 200 characters. The button remains bright blue if a comment has been added but the container not yet saved.
- Stores details for all tabs
On edit, two additional buttons are available:
- Only available from the Watches tab and deletes the container
- Only available from the Watches tab and copies the container name ("Name - copy"), description and full list of watches. Note: the duplicate container does not include any settings from the Maintenance tab
Logo Management
A container can be customised to show a logo of your choice. If a container is also a service tile, this makes the tile instantly recognisable on the Status Heat Tiles page.
Click the Logo Management button and the dialog shown below opens:
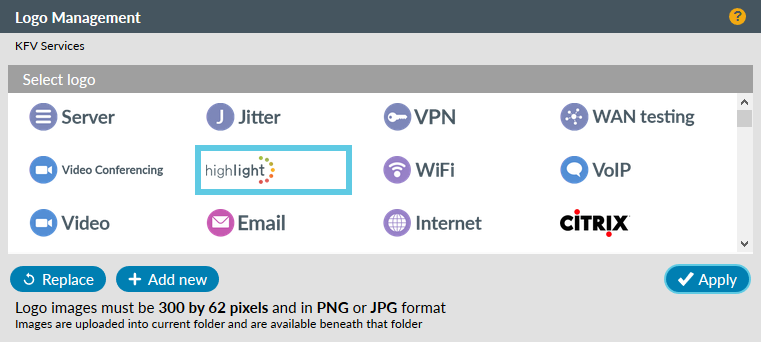
This dialog enables you to:
- manage the logo library (upload new icons and replace existing icons)
- apply a logo to a service tile
Manage logo library
Upload a logo
- Click
- Navigate to the file on your network
- Select the logo
- Click Open to complete the upload
Replace a logo
- Select the logo to be replaced in the library (marked with a pale blue indicator)
- Click
- Navigate to the replacement file on your network
- Select the logo
- Click Open to complete the replacement
Repeat these steps as necessary.
Apply a logo
If the logo you want to use is already in the library, select it (a pale blue indicator shows your selected logo) and click
If the logo you want to use is not in the logo library or needs to be updated, follow the steps above to upload or replace.
Watches tab - main panel
The main panel is divided into 3 columns: Folder or location; Available watches; Included watches
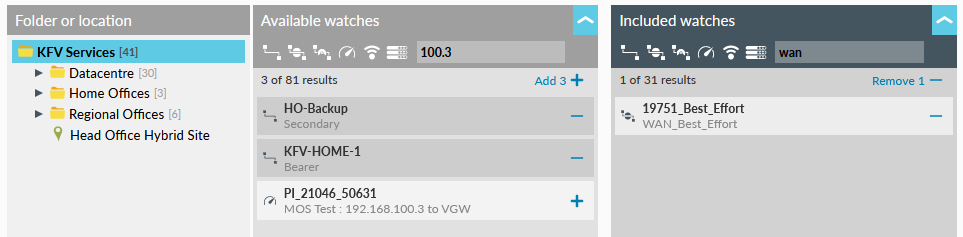
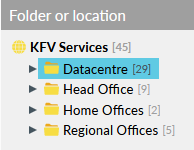
Folder or location
(left panel) To add watches to a container, first select a folder or location. All the watches beneath that folder or location will appear in the middle panel, so you can choose which ones to add.
Available watches
(middle panel) Click to add a watch, or click Add X to add the results of any filtering.
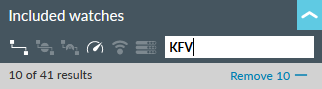
Included watches
(right panel) See a list of all watches currently included in this container. Use to remove one, or click Remove X to remove the results of any filtering. Changes are not stored until you click .
Note: a container used for maintenance will include subwatches by default (for example VLANs).
Filtering (middle and right panels)
You can filter the lists in the middle or right panel.
- The chevron opens the filter panel. It turns to bright blue to indicate settings have changed from the defaults and that filters are still active
- Search watches
- Enter text to select watches whose name or description contain that string (case is ignored). You can also search on device address (IP address or hostname) and test name
- X of Y results
- Y is the total watches available in the folder or location selected in the left panel
- X is adjusted according to any filters which have been applied
- Add X +/Remove X -
- Add or remove the filtered list of watches
Clicking a white icon turns it grey and excludes those watch types from the list. Icons have the following meanings:
- for bearers
- for classes, multilinks and VLANs
- for SD-WAN tunnels
- for performance tests
- for Wireless Access Points
- for switches
- the middle and right panels show a maximum of 200 watches though it's possible to add more than 200.
Add X + and Remove X - show what can be added/removed. - to add a Meraki switch or a performance test under a SD-WAN tunnel, add the parent watch.
Tile tab
Permission needed: Edit watches
Use this tab to enable a container to appear as a service tile on the Status Heat tiles page, Services section.
Name, Description, Logo, and Visibility are explained above, in the section "Create and edit a container"
- Show as tile
- Enabled or Disabled, enable this container to appear as a service tile or disable it
- Tile preview
- A preview of the tile is shown using the description (if available) or name and logo (if available). The preview is greyed-out if the tile is disabled.
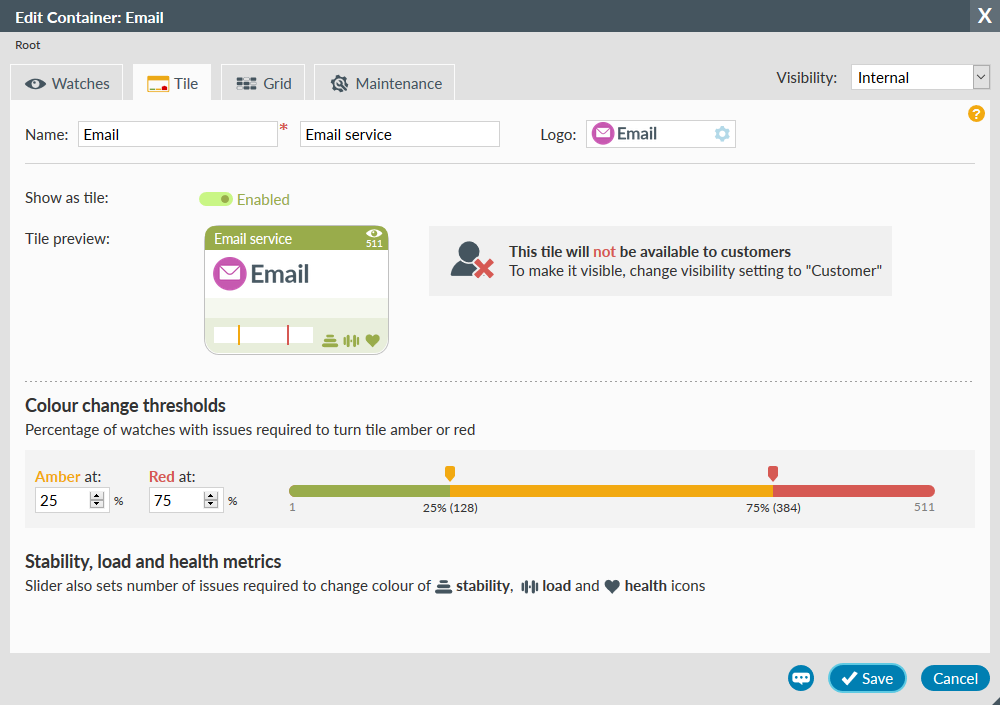
Colour Change Thresholds
Use either the sliding bar or the percentage input boxes to set the points when this tile changes to amber and red. The number of watches which match each percentage are shown on the slider. Default values are 25.000% for amber and 75.000% for red. This means that 25% of all the watches linked to this container must be in a red state to turn the service tile amber.
Note: watches in an amber state do not count towards this percentage, only those in red state.
Stability, load and health metrics
The service tile shows stability, load and health indicators. These change colour using the same percentages as the overall tile. For example if the amber setting is 25% and red is 75% then the load icon remains green until there are 25% or more red load issues, when the icon will turn amber. It reverts to green if the percentage drops below 25%, but will turn red if the percentage of red load issues goes above 75%.
Read more about service tiles.
- Click this button to record a comment in the Audit log against updates for this container. An input box expands to the left and comments can be up to 200 characters. The button remains bright blue if a comment has been added but the container not yet saved.
- Stores details for all tabs
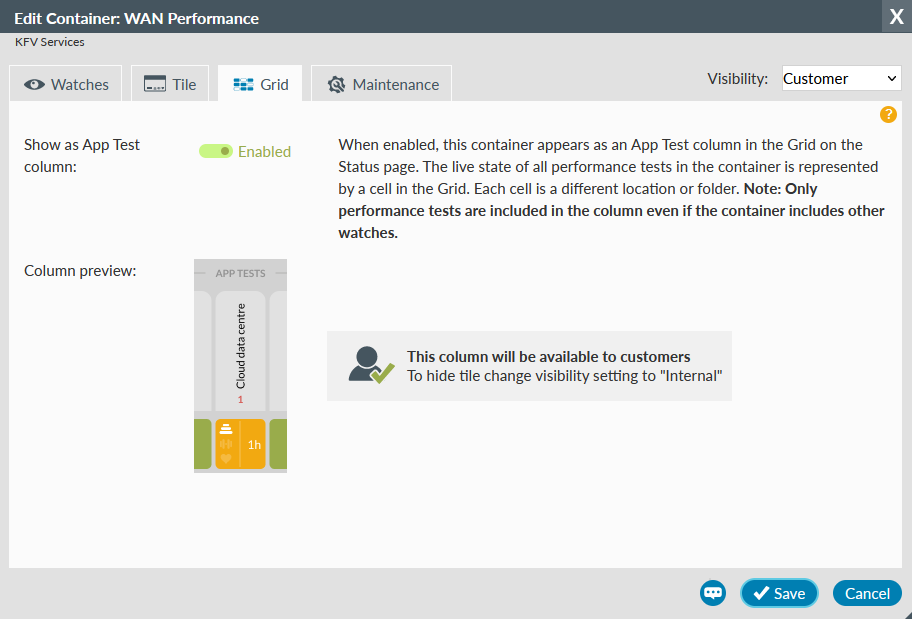
Grid tab
Permission needed: Edit watches
When enabled, this container appears as an App Test column in the Grid on the Status page. The live state of performance tests in the container is represented by a cell in the Grid. Each cell is a different location or folder. Note: Only performance tests (with "Show Data" checked on the parent watch) are included in the column even if the container includes other watches.
Visibility is explained above, in the section "Create and edit a container".
- Show as App Test column
- Enabled or Disabled, Enable this container to appear as a column in the Grid or disable it
- Column preview
- A preview of an App Test column is shown.
Read more about Grid view.
- Click this button to record a comment in the Audit log against updates for this container. An input box expands to the left and comments can be up to 200 characters. The button remains bright blue if a comment has been added but the container not yet saved.
- Stores details for all tabs
Maintenance tab
Permission needed: Manage maintenance
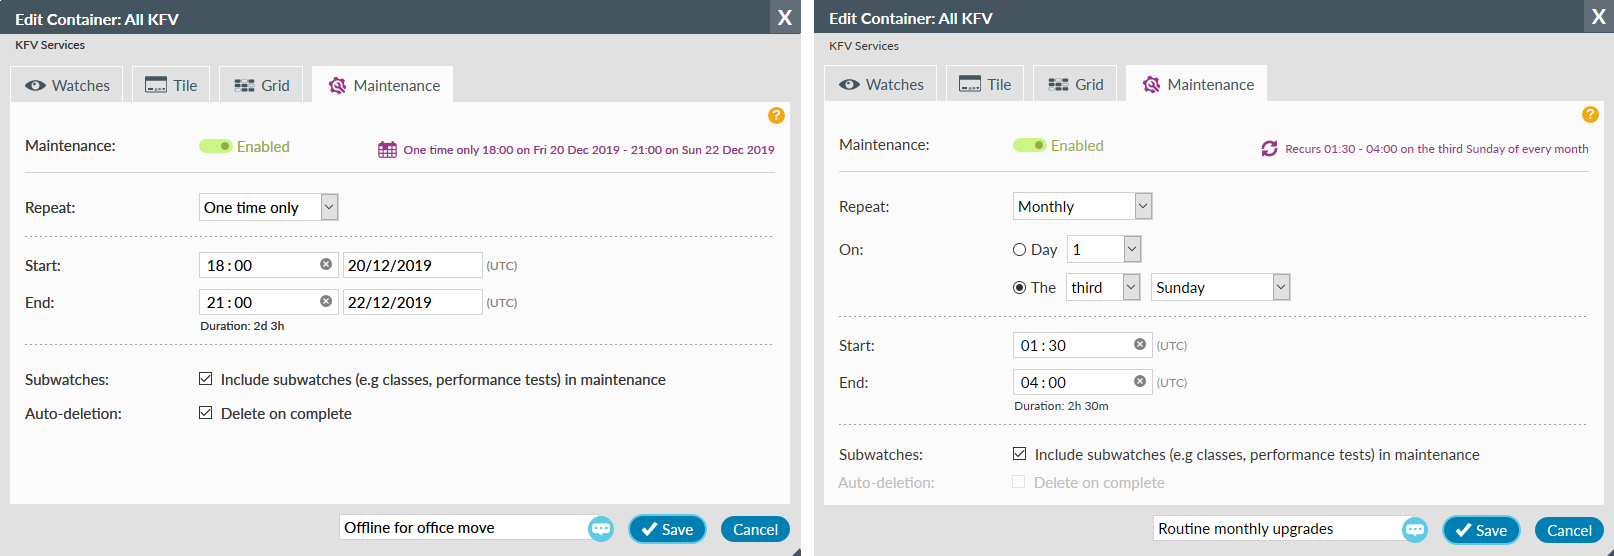
Use this tab to enable and schedule a maintenance window on a container. Watches in maintenance do not send alerts, change the colour of heat tiles nor decrement availability figures.
- Maintenance
- Enabled or Disabled, enable or disable a maintenance window on this container
- Summary message
- Top right, see a message showing, for example:
- One time only 18:00 on Fri 20 Dec 2019 - 21:00 on Sun 22 Dec 2019
- Recurs 02:00 - 04:00 every day
- Repeat
- Recurring maintenance windows start on save and continue indefinitely unless disabled or the container is deleted, repeat options:
Monthly recurring
To avoid potentially skipping months, maintenance windows cannot be set to repeat on the 29th, 30th or 31st day of a month
- One time only
- Set start and end dates and times in UTC
- Daily
- No other selections needed
- Weekly
- Choose a day of the week
- Monthly
- Choose either
- a day from 1 - 28
- or a combination such as the third Sunday
- Start/End
- Add times in UTC, add dates for one time only maintenance windows.
Note: to set recurring maintenance spanning midnight, add an end time for the next day. The summary will show the period, which cannot exceed 24 hours: - Recurs 22:00 - 02:00 every Saturday
- Duration
- Shows in days (d), hours (h) and minutes (m), recurring maintenance windows cannot exceed 24 hours
- Subwatches
- Autodiscovered watches such as classes of service, VLANs and WAPs or created watches such as performance tests are all "subwatches." By default, these are automatically in maintenance when the parent bearer is in maintenance. Uncheck to exclude subwatches from maintenance. To exclude only some subwatches, uncheck here to exclude all then return to the Watches tab and add in those subwatches that should be in maintenance.
- Auto-deletion
- Automatically delete this container 24 to 48 hours after the maintenance window finishes. This option is available for one time only maintenance windows which are not also service tiles and disabled for all other scenarios. If available then, by default, this is checked; uncheck to stop deletion. Containers can be manually deleted at any time.
- To record a comment for updates to this container, click this button and an input box expands to the left. Any comment will be added to the audit log entry for this container on save. Comments can be up to 200 characters in length. The button remains bright blue if a comment has been added but not yet saved.
- One save stores details for this and all other tabs
- Only available from the Watches tab and deletes the container