Create watch
Overview
This page explains how to add individual watches into Highlight. For service providers with a requirement to add multiple watches (10 or more) there is an alternative process which is explained on the bulkloading watches page.
Find out more about pending watches. View our What's a watch infographic to see the full picture of how watches are used in Highlight.
Watch the admin training video for Create watches
Create a watch
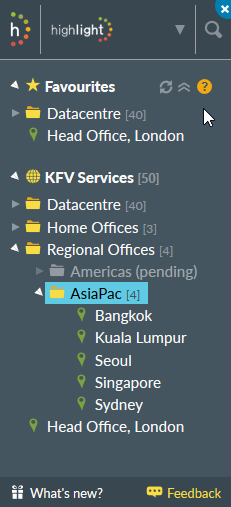
Select the point in the Network Explorer tree (or using Admin Browse) where the new watch will be created. This must be a location or a folder which contains one or more locations.
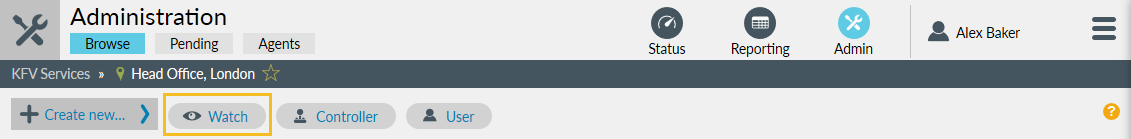
There are two options to create a new watches:
1. Under the Admin Browse, click Create New and select Watch
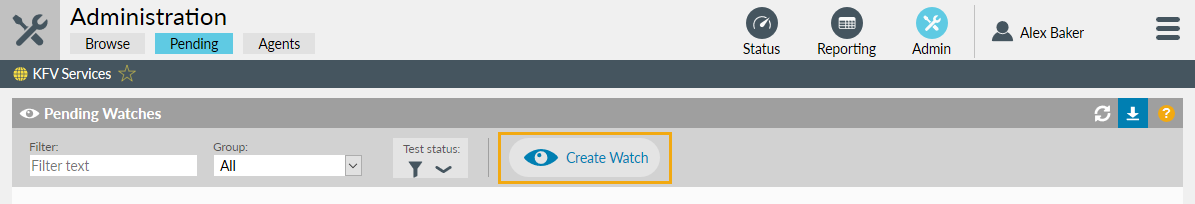
Or 2. Under Admin Pending, click Create Watch
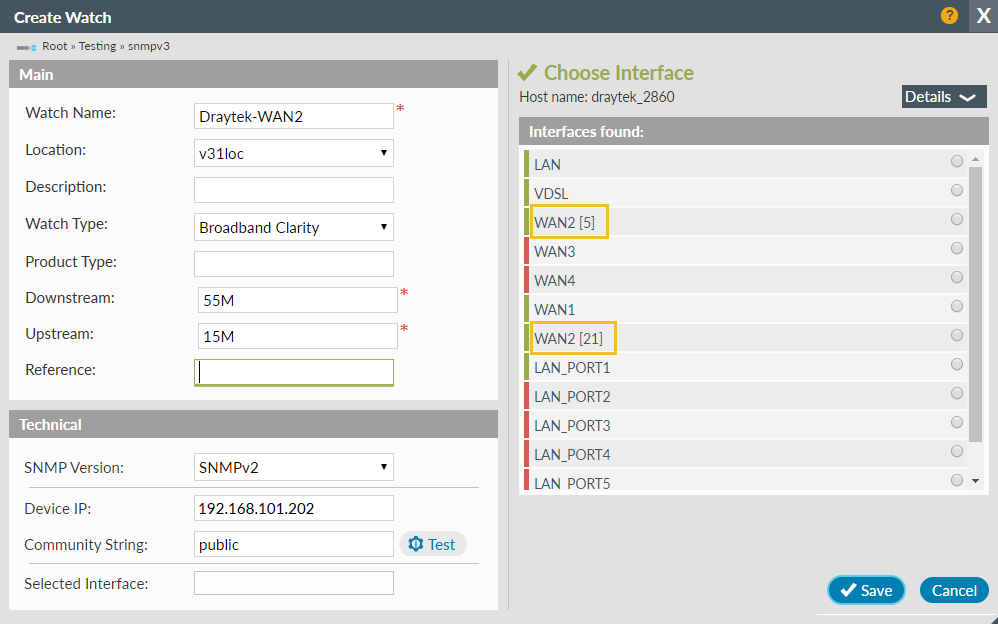
The Edit Pending Watch dialog is used to edit a watch before it is made live. The path to the folder is shown along with the group (if applicable). There are 5 areas:
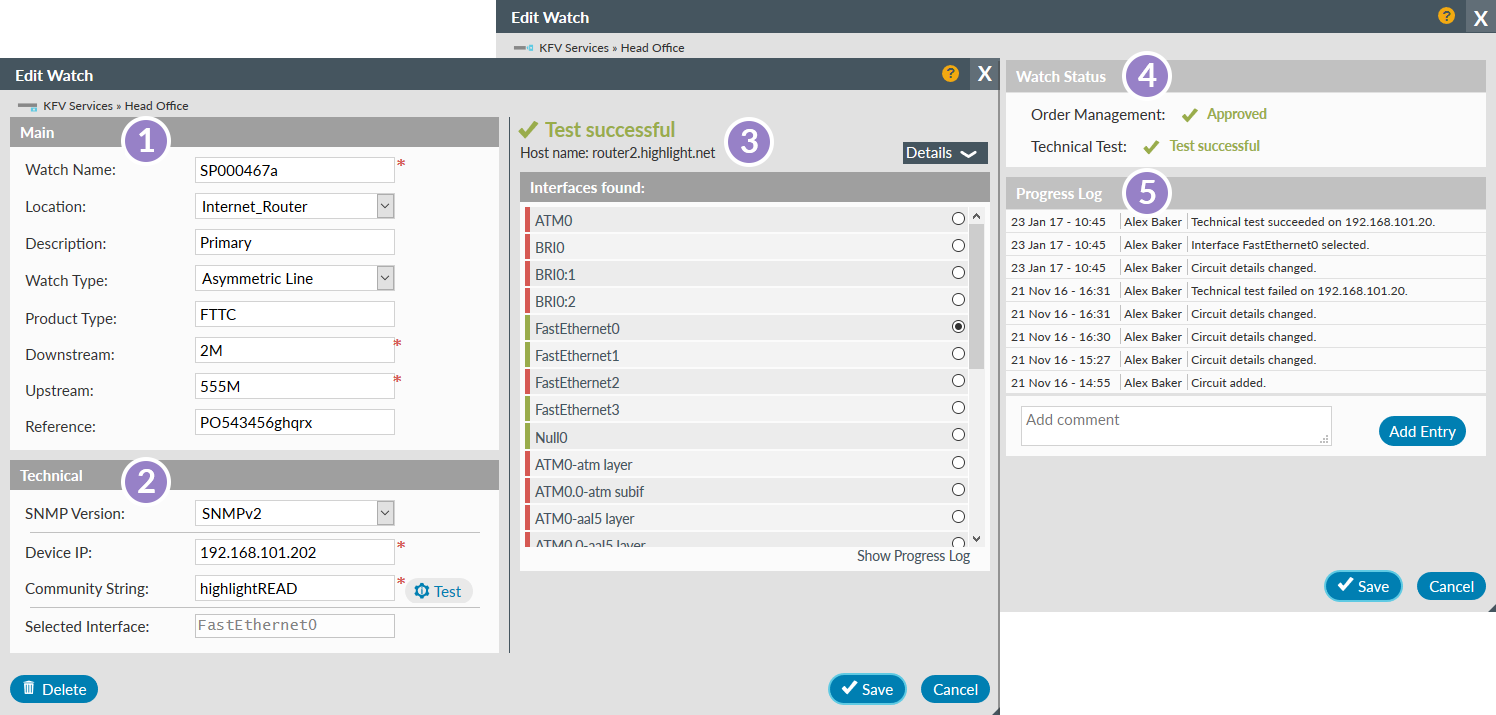
- Main
- Technical
- Test Results (visible immediately after a test only)
- Watch Status (visible after a test and the watch has been saved and reopened)
- Progress Log (visible after a test and the watch has been saved and reopened)
It's possible to save the details at any point. You can return to this dialog at any time to complete the process.
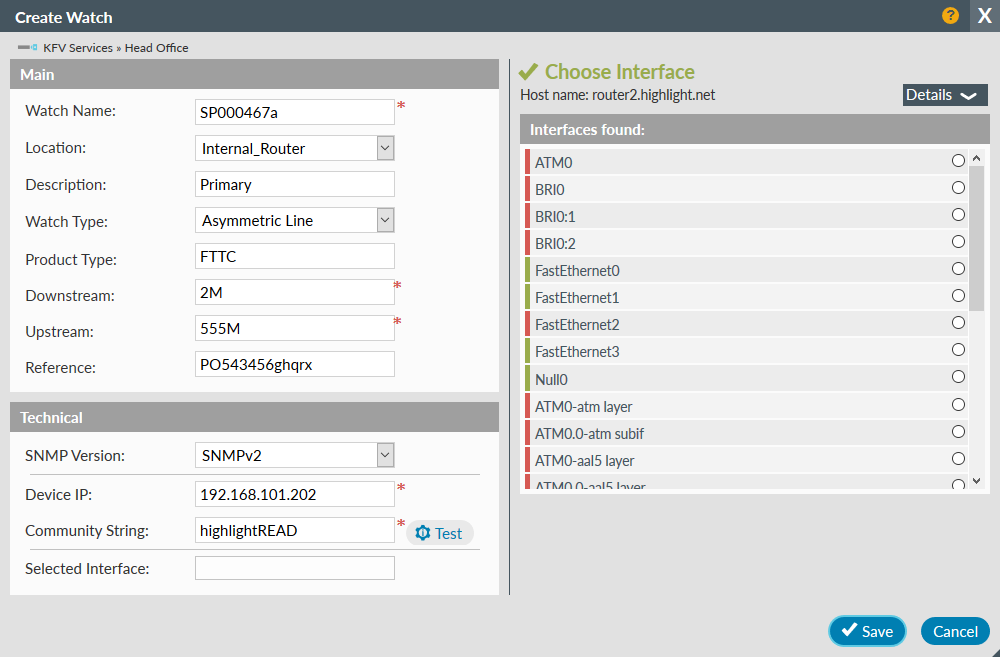
1. Main
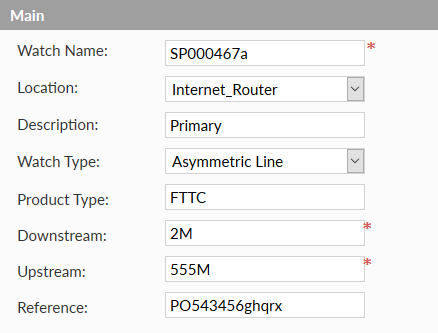
- Watch Name
- this is a required field which uniquely identifies the watch; it must not exceed 100 characters in length.
Valid characters are A-z 0-9 . - _ + ! $ # @ = - Location
- select the required location from the drop-down list if not already displayed
- Description
- this is optional and is displayed in Highlight in place of the watch name
- Watch Type
- bandwidth options available will change based on the type selected, see the table below:
- Product Type
- this is an optional text field which is limited to 20 characters and enables service providers to display the service name for a watch rather than the Highlight default name, for example FTTC instead of ADSL.
- Bandwidth
- see GIF and table below
- Reference
- Reference is optional and may be useful for customer specific information, for example Purchase Order
Both bandwidth fields are required. Start typing and select a bandwidth from the displayed list. Alternatively enter any whole number with one of the following units:
- b/B: bits per second
- k/K: kilobits per second
- m/M: megabits per second
- g/G: gigabits per second
- t/T: terabits per second
| Watch Type | Bandwidth 1 | Bandwidth 2 |
|---|---|---|
| Leased Line (Dedicated Access, Ethernet) | Bandwidth | On bearer of |
| Leased Line + Class of Service (MPLS) | Bandwidth | On bearer of |
| Multilink/Bonded | Bandwidth | On bearer of |
| Asymmetric Line | Downstream | Upstream |
| ADSL Max | Downstream | Upstream |
| SDSL | Downstream | Upstream |
| Broadband Clarity | Downstream | Upstream |
2. Technical
The options available in this section will change based on which protocol (SNMPv2 or SNMPv3) is selected. It's possible to save the watch without completing this section but it will not be possible to test nor activate it.
These fields are common between all protocols:
- Device IP
- the device IP address
- Selected Interface
- if an interface has previously been selected, it will be shown
SNMP v1
If your device only supports SNMPv1, select SNMPv2 and Highlight will fall back to using the older protocol when it finds that SNMPv2 doesn’t work.
SNMP v2
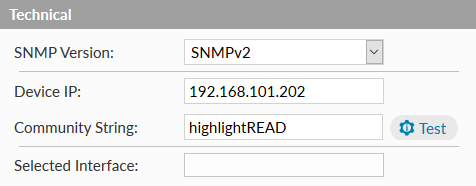
- Community String
- can contain any characters except spaces
SNMP v3
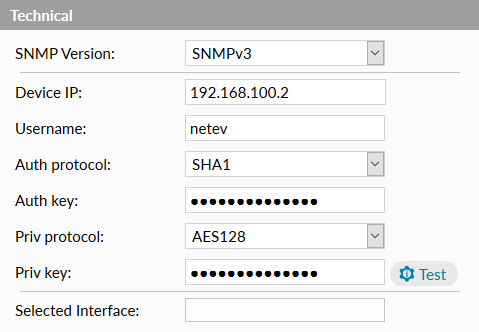
- Username
- must be between 8 and 32 characters and may not contain ,\' and “
- Auth protocol
- MD5 (default) or SHA1
- Auth key
- must be between 8 and 32 characters and may not contain ,\' and "
- Priv protocol
- DES (default) or AES 128
- Priv key
- must be between 8 and 32 characters and may not contain ,\' and "
After all options are completed, the watch can be tested
3. Test Results
After clicking you may briefly see the message Testing...
After a successful test, you will be prompted to choose an interface (Note: it's also possible to save the watch without choosing an interface.) Immediately after interface selection, you will see Test successful
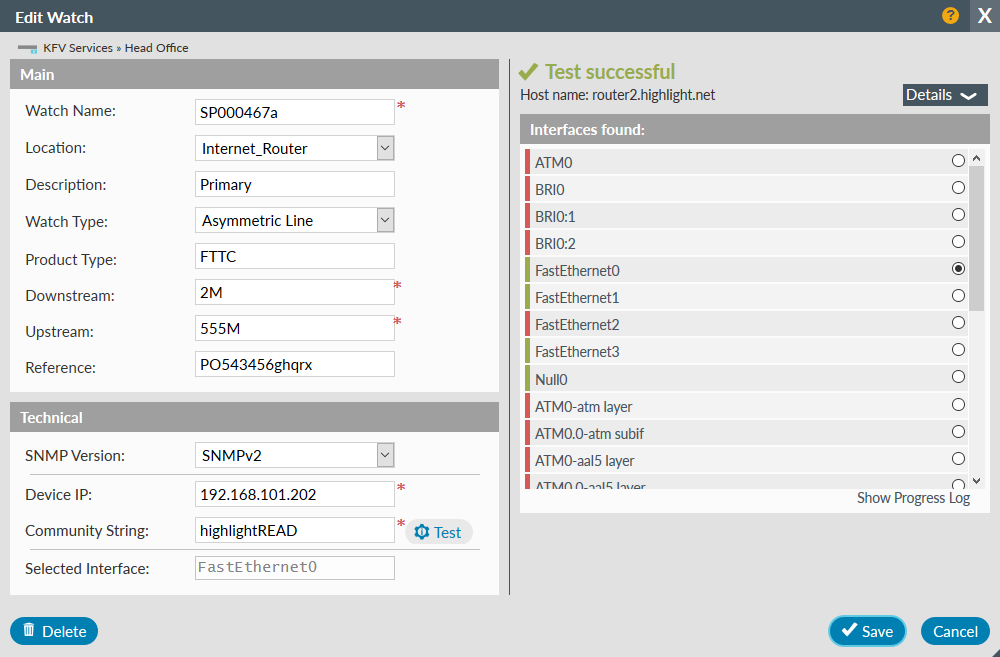
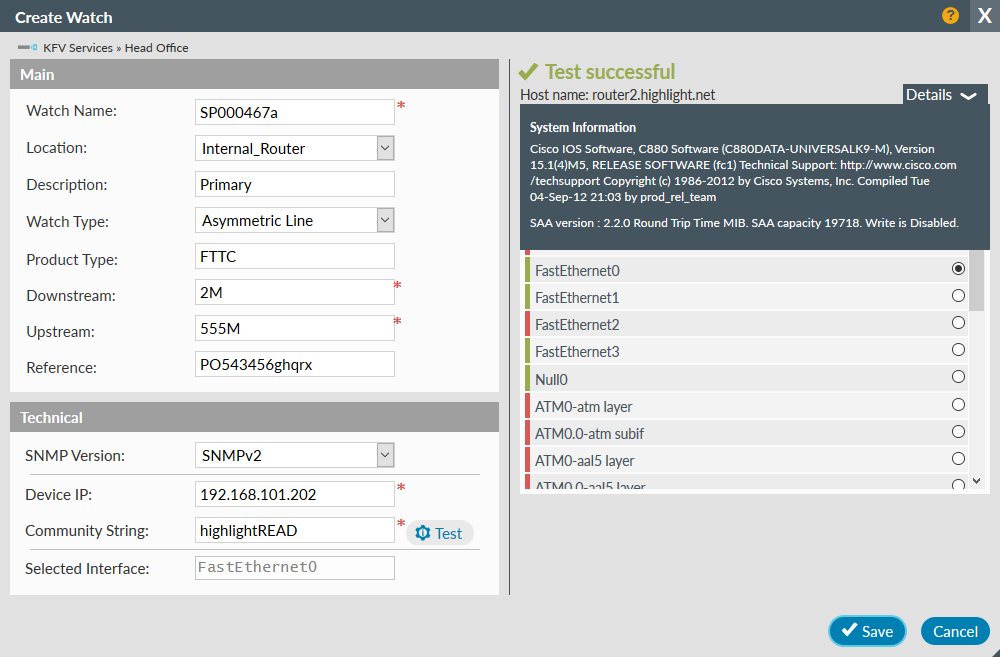
Clicking on Details will show additional details related to the test.
After clicking if you then edit the watch, Watch Status and Progress Log will now be visible.
Note: the interface list for Draytek devices may contain duplicate names. The interface number will be displayed as a suffix to distinguish between them, for example: WAN2 [5]. Select the lowest interface number.
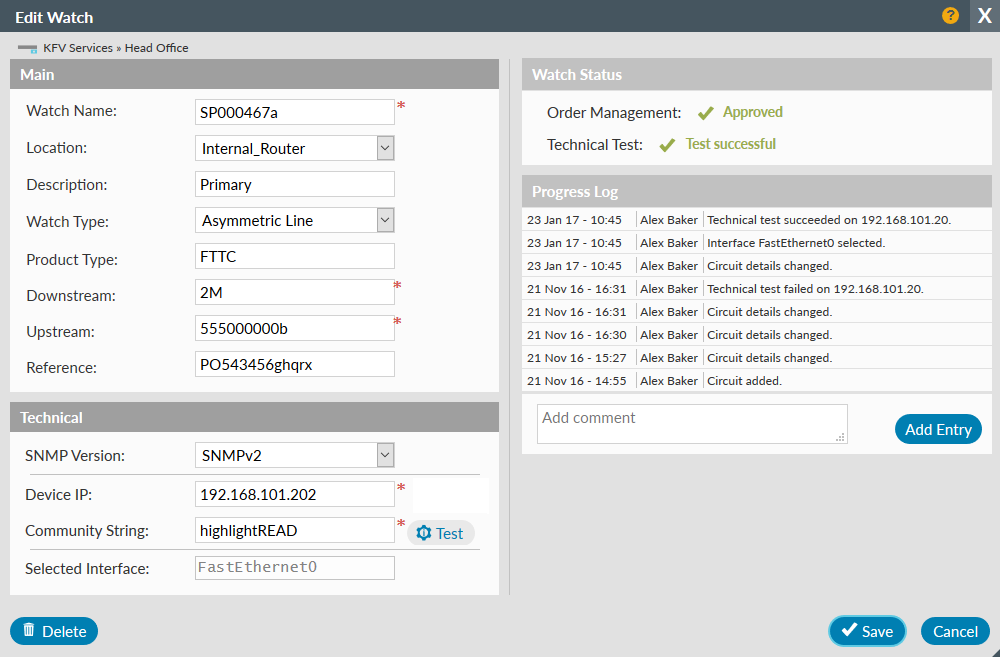
4. Watch Status
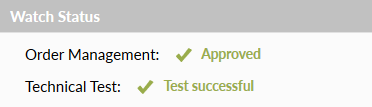
Order Management has two possible states which can be changed by those who have the security privilege Approve New Watches checked in the Add/Edit User dialog:
- Approved
- Not Approved
Technical Test has three possible states in this dialog:
- Test successful
- Test failed
- Interface not selected meaning no interface was selected following a successful test or no interfaces were listed for selection
Test in progress, meaning the test has started but not yet completed, is only seen when testing more than one watch so will not appear in this dialog
5. Progress Log
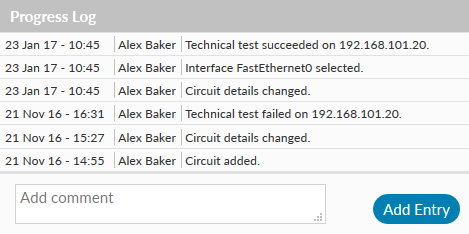
This is a list of automatically added events such as:
- Circuit added
- Circuit details changed
- Approved by order management
- Technical test succeeded/failed
- Interface selected
Use to add your own comment.
Times are in UTC.